This post originally appeared on Guardium by Example.
Guardium Insights GA’d a few weeks ago, so let’s talk about some bread and butter Guardium requirements and see how they’re implemented in Insights. SOX monitoring, in my experience, is one of the most common requirements for customers using Guardium. Now, it is less common that it’s the only requirement, but it is likely that SOX or requirements that are similar to SOX’s are somewhere in the mix. Here, we’re looking at privileged users and threats to data integrity (ie: modifications).
Overview
In this post we will look at the following:
- Common Themes in SOX Requirements
- Implementing Some Required Groups
- Populating the Groups with CSV Files
- Implementing Some Reports to Fulfill the Requirements
- Delivering Those Reports Regularly to Report Consumers
Let’s start with requirements.
SOX Requirements
Before we get into specifics, please note that you should not treat the information in this post as legal advice nor the official position of IBM. More information can be found in this disclaimer. SOX requirements, when it comes to Guardium at least, require that there be some assurances that the financial data inside an organization’s databases are accurate. The applications dealing with financial information have checks and balances meant to ensure that the data is accurate, but what if someone who has sufficient privileges (eg: a DBA) makes changes outside of those applications? In those cases changes are allowed but must be accompanied by a formal change management process. This is where Guardium comes in, providing an audit trail for privileged users to help ensure change management is being followed.
So, we care about privileged users. As mentioned earlier, we also care about accuracy of the information. This means, for SOX requirements at least, we care primarily about changes to the database. This makes SOX requirements, broadly speaking, data integrity requirements.
Now, let’s decompose this requirement a little further. This is where things start to differ between auditors. You should work with your auditors to develop a definition of “changes to databases” and “privileged users” for your organization when it comes to database monitoring. “Changes” typically tend to be a combination of the following from most to least common (in my experience):
- DML Statements (INSERT, UPDATE, DELETE, etc.)
- DDL Statements (CREATE, ALTER, etc.)
- DCL Statements (GRANT, REVOKE, etc.)
- Other administrative commands (eg: administrative stored procedure execution)
For privileged users, one of the following is typically used. Here the order is from narrow to broad:
- Specific known users with DBA privileges
- Specific known users that can log into the database directly and execute ad hoc SQL
- Any execution involving a source program, user, and/or client IP (or hostname) not associated with an application or batch service
- Any user that has sufficient privileges to execute a change
That last one can be problematic. You are effectively removing “privileged user” as a filter since any successful execution of a change would have to be recorded. In other words you also report on application and batch traffic. As a result, monitoring is actually dramatically less effective in practice. That may surprise you but this data needs to be reviewed and presenting all changes to the data makes that review less effective. Those applications, after all, have their own controls and audit systems that get reviewed and crucial context of the changes are invisible to Guardium. It is one class of traffic best left to the application layer.
So, for our example, let’s assume we talked to our auditor and came to the following agreement:
| Audit Definition |
Description |
| Privileged Users |
Any execution involving a source program, user, or client IP (or hostname) not associated with an application or batch service |
| Changes |
DML and DDL |
Definitions for our SOX example
Groups
For implementation, a good practice is to take the categories of nouns in your requirements and associated them with a group. So let’s list them with their types:
- DML Commands: Command
- DDL Commands: Command
- Business Application Source Programs: Source programs
- Business Application User Accounts: Database users
- Application Server IPs: IP addresses
Note that our application server IPs here will contain Client IPs because application servers are the clients of database servers. The good news is DML and DDL commands are built-in groups for Guardium Insights (and traditional Guardium) so we do not have to rebuild those (unless we have an exotic database target with new verbs). The other three though are custom groups we’ll have to build ourselves. We’ll use the menu to access the groups editor.
Navigating to the Group Editor: Menu --> Groups
Now click Add group and add the last three groups mentioned in the list above. Here’s “Application Server IP” as an example. Do the same for “Business Application Source Program” and “Business Application User Account” but provide Source Program and DB User types.
Creating the 'Application Server IP' group
Here they are. You can sort by source to find all the user-defined groups which is quite useful if you want to get at the groups you’ve created earlier - A nice feature if you’re tired of prefixing group and other definitions names with “–” or “*” or something else.
Our list of three new groups
Group Population
We have some empty groups! If you happen to know a lot about your environment ahead of time because you have good system and user management processes and conventions, you may be able to populate those three custom groups. Let’s assume you don’t though and we need to create them ourselves using the audit history. Either way, populating the groups yourself based on the audit history is a good way to get started.
Let’s start by running the “Connection profiling list” report. Click Menu, then Reports.
Navigating to the Report Editor: Menu --> Reports
Now, search for “connection” and press enter. 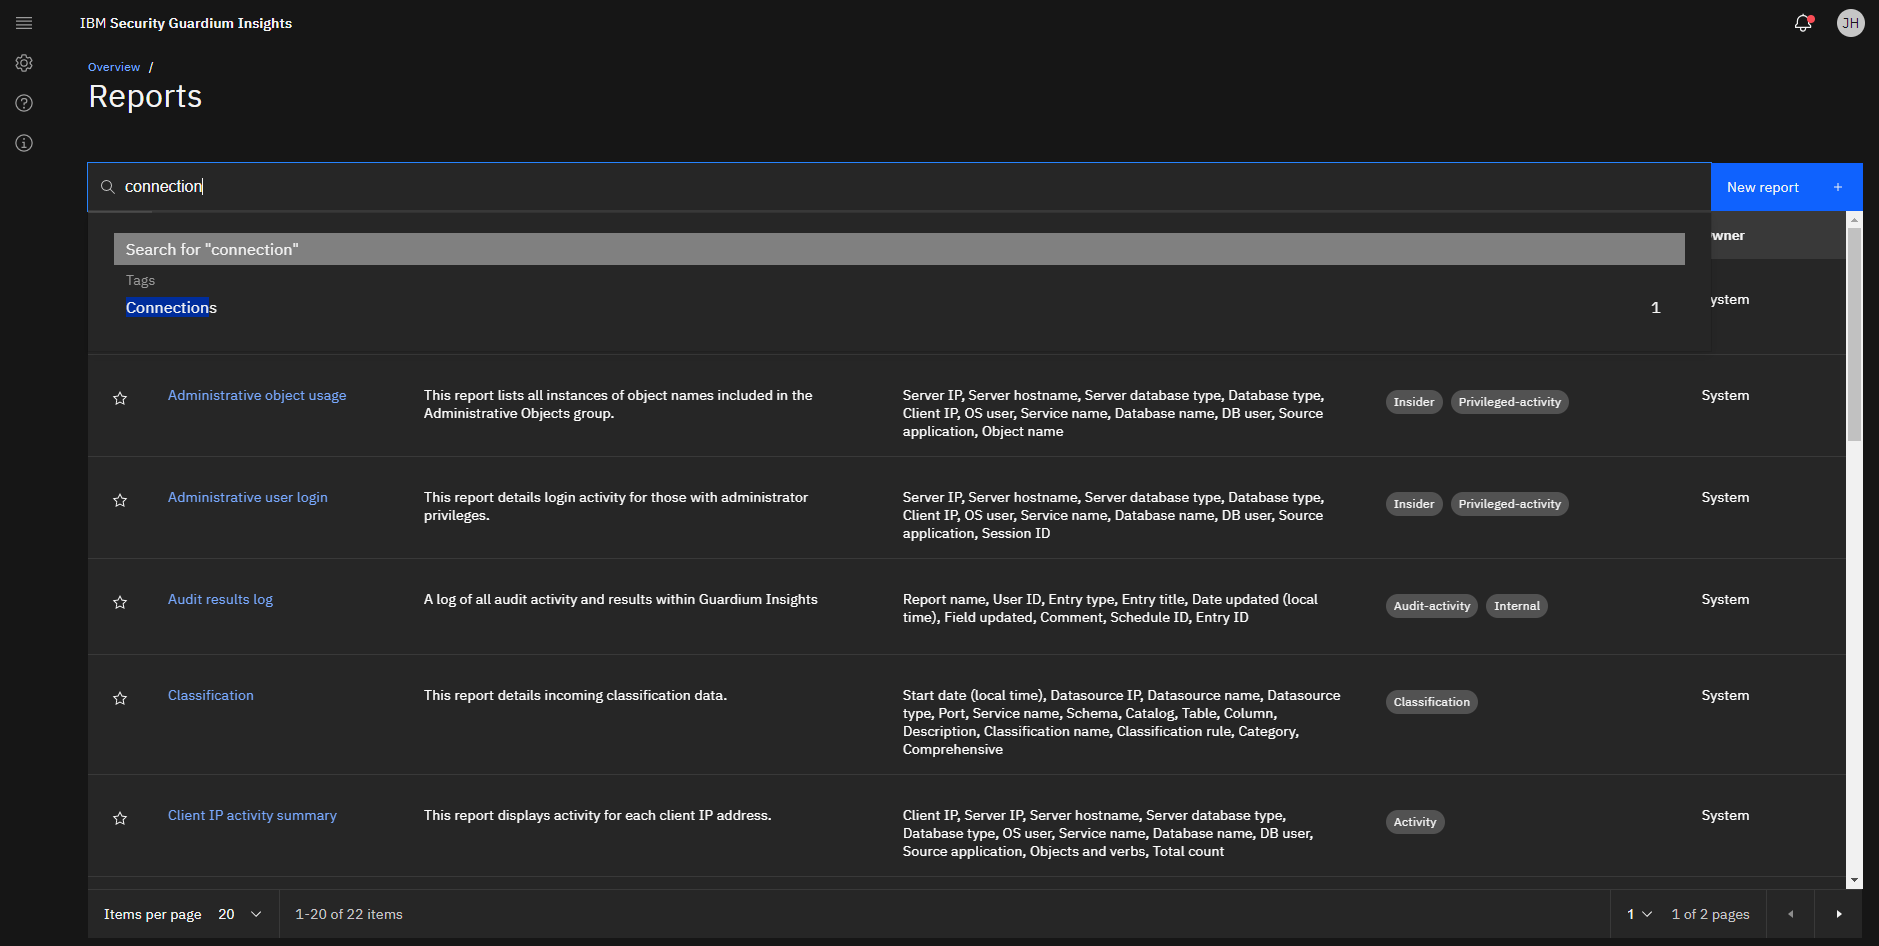
Search for the name or use the tag to find the 'Connect profiling list' report
You may want to adjust the time frames for the report to a long period of time so that you get a representative sample of connection data. You want something with a long time frame to try be as complete as possible. Anything you fail to filter out now will have to be done manually later as usual upkeep. The good news is that the connections you want to filter out are the most common ones in the database environment.
Adjusting the time frames for the report
Now you have the session profile report. Export to CSV from here.
Export to CSV
Go through the CSV file and remove all the items you do not want to ignore, leaving those source programs, client IPs, and DB Usernames you care about. A good way to do this is look for naming conventions on Client Host Names and usernames for personal computers and accounts. For source programs look for known DBA tooling such as TOAD, MS SQL Server Management Studio, SQLPLUS, Embarcadero DB Artisan, DBeaver, DB Visualizer and others. When in doubt err on removing it from the list - that will include it in the report in our example. You can review the end result of application/batch access with your partners in compliance.
Now let’s go back to the group editor in Guardium Insights and import what remains. Find the groups you created before and click on them to edit their members.
Select a group
Once in the members editor, click the drop down next to add member and select “import from CSV”.
Import from CSV
Select the appropriate column to import. In this case we are importing into our Client IP group, so we pick the Client IP column.
Select column to import
If you get the following message, just click yes. Groups in Guardium have always been unique entries. This is just a warning that some entries are not unique.
Warning that the imported members are not unique
Those members get imported. In my example with test data, I only have nine Client IPs, but it is normal and fine for the number of members in these groups to be much larger.
Imported group members
Do the same for the other two groups (Business Application Source Programs and Business Application User Accounts). One more thing before we leave the group editor and build our reports. Let’s create a hierarchical group that contains both DML and DDL statements.
Creating a parent group for DDL and DML commands
Note that the “Set as parent group” check box is selected above. Once created, add two members to the parent group. Namely “DML Commands” and “DDL Commands”.
DDL and DML Commands in the parent group
Those who are used to using traditional Guardium on collectors and aggregators might now be wondering “time to schedule group flattening and group synchronization between appliances”. Those concepts do not exist in Guardium Insights. Parent groups are auto-flattened and immediately reflect the contents on their children. Groups also exist in a single place not across multiple Guardium machines. We can create the parent group and move on to report building.
Building the Reports
We have our groups, now to build our reports. We will create three reports - one for each kind of access outside of application or batch contexts. That is one report where Client IPs are not known application servers. One report where Source Programs are not from known application or batch source programs and one where the users are not known application accounts. Let’s start with the report showing changes from sources other than those connecting from application server IPs.
Access the report editor by click on the menu.
Navigating to the Report Editor: Menu --> Reports
Let’s create a new report. For SOX you are likely going to create a report on DB Activity of Full SQL. I suggest DB Activity. Dealing with data the the Full SQL level tends to create reports with a very large number of rows. Many people want detail though, so a good trade off is to report on SQL Constructs (AKA Instances) which are skeletons of SQL with the parameter values removed. This is normally more than enough information to confirm that a change corresponds to the change ticket which, if you’ll remember our earlier discussion, is the purpose of SOX auditing.
Create a new report with this button. Choose DB Activity
When create the report we want to think about the goal of the report and include only the information required to achieve the objective. Too little information fails to achieve the goal, but too much information also hurts - it makes it harder to understand the data. The goals for our reports are:
- Is the change in a context outside of application or batch users (ie: are our groups correct and up-to-date) and
- Is the change in question reflective of an approved change control ticket
Given that, we want some information on who is doing the access and what they are modifying. Here’s the list I picked:
- Period Start
- Client hostname
- Client IP
- DB user
- OS user
- Source application
- Service name
- Database type
- Server database type
- Server hostname
- Verb
- Object name
- Mask SQL query
- Number of successful SQL queries
- Number of failed SQL queries
“Mask SQL Query” is one way of thinking of constructs, but we aren’t really using this column here to prevent sensitive data exposure (although, that’s an added bonus). Our real benefit is reduction in the number of rows reported (and thus having to the viewed by reviewers).
Next, switch to the filter area of the report editor.
Switch to the filter area
When editing the filter, expand the Client IP area, and find the “Application Server IPs” group we created in the groups section above. Click on the three dots to get to the options for the group and select “Not in group”.
Select Not in group for Application Server IPs
Now apply the new filter.
Click apply filters
Let’s add an In group filter for the “DDL and DML Commands” group on the SQL Verb column and apply that as well.
Filter by DDL and DML Commands
You should have two filters applied now and can see how they are configured at the top of the screen.
Filters that have been applied
Looks good! Finally, let’s save this report by clicking the Save as button at the top right.
Click 'Save as' to save the report
Give the report a name and click save. I went with the long-winded “SOX - Changes from clients that are not application/batch servers”.
Giving the report a name
Let’s create the two other reports. They are the same except for the “Not in group” filter so you can clone using the “Save as” button and then change the filters.
Report for non-application/batch database users
Report for non-application/batch source programs
Those are our reports! Let’s schedule their delivery.
Report Scheduling
What we want to do now is schedule the reports to get delivered on a regular basis - let’s go with weekly. To do that, navigate to the “Audit settings” section of the “Settings” menu.
Navigating to audit results in the menu
Click “New audit” to create a new one.
Click this button to create a new audit process
Provide a title and description for the audit.
Providing a title and description for the audit
I skipped the audit owner section as the individual reports are going to be signed off on anyway. Select the first SOX report and add a description and some useful instructions for the report receiver. As for the task owner - the person that receives the report, I’ve seen this often defined as a compliance officer, which is good for separation of duties, or the DBA manager, who has the most context on if a change was logged and approved, or both.
Adding the first audit task
Now do the same for the other two audit tasks in the audit.
Adding the second audit task
Once that is done, click the Next button.
Click Next
Now schedule the audit process to happen weekly - I like monday morning audit process results.
Scheduling the report
Review the audit parameters and click finish.
The end of the audit creation wizard
We’re done! They will get the reports weekly.
The Newly created audit
Next Steps
Even though we’re done, it is good to reflect on how things might be improved. We could include a change ticket number in the report if the DBAs provide it while executing the change. This would make cross referencing Guardium with the ticketing system easier. That is currently possible and we may explore that process in another article. Then, if the DBAs did that, we could take this a step further, import the change tickets, and join them to the audit data like you can in traditional Guardium. Unfortunately, that function is not yet in the product. Watch this space to hear about if and when that becomes possible. One last thing is that these reports will generate duplicate data between them. That means more information to review. I’ll update this article if and when that becomes possible as well.
Conclusion
In this example, based on a typical set of SOX requirements for Guardium, we performed the following tasks:
- A requirements analysis and decomposition
- Implemented the required groups
- Populated the groups with CSV files
- Built three reports
- Scheduled report delivery
Hope you found it useful! Remember, this guide isn’t a replacement for thoughtful SOX auditing in Guardium, but can be a good place to start if you are stuck. Talk to your auditors and make sure you are fulfilling your company’s needs.
`