When you are using Chart Builder to graph a High-Low-Close chart, it is actually giving you a High-Low-Mean chart by default. This post will explain how to add percentiles to the chart, along with adding labels and customizing the labels.
I will be using the English version of the Employee Data.sav file found in the Samples folder in the installation directory for this example.
Open the Employee Data.sav file and navigate to the Graphs->Chart Builder dialog, select the High-Low choice from the Gallery, and drag the first chart type to the canvas. This is the High-Low-Close chart. Drag the Employment Category variable to the X-axis, and the Salary variable to all three slots on the Y-axis, and click on the Paste button. This will give you syntax that looks like this:
GGRAPH
  /GRAPHDATASET NAME="graphdataset" VARIABLES=jobcat MAXIMUM(salary)[name="MAXIMUM_salary"]
    MINIMUM(salary)[name="MINIMUM_salary"] MEAN(salary)[name="MEAN_salary"] MISSING=LISTWISE
    REPORTMISSING=NO
  /GRAPHSPEC SOURCE=INLINE.
BEGIN GPL
  SOURCE: s=userSource(id("graphdataset"))
  DATA: jobcat=col(source(s), name("jobcat"), unit.category())
  DATA: MAXIMUM_salary=col(source(s), name("MAXIMUM_salary"))
  DATA: MINIMUM_salary=col(source(s), name("MINIMUM_salary"))
  DATA: MEAN_salary=col(source(s), name("MEAN_salary"))
  GUIDE: axis(dim(1), label("Employment Category"))
  GUIDE: axis(dim(2), label("Current Salary"))
  SCALE: cat(dim(1), include("1", "2", "3"))
  SCALE: linear(dim(2), include(0))
  ELEMENT: interval(position(region.spread.range(jobcat*(MINIMUM_salary+MAXIMUM_salary))),
    shape(shape.ibeam))
  ELEMENT: point(position(jobcat*MEAN_salary), shape(shape.circle))
END GPL.
Now I want to remove the mean, and add percentiles. In this case I'm going to add points at percentiles 25, 50, and 75. In addition, I'm going to add points for the minimum and maximum, which will allow us to label the. I also added labels to each point, and made the shape a plus symbol. For the Minimum and Maximum points, I set the transparency to 100% (1) so that the point doesn't show, and it looks like we are labeling the crossbeam value. The syntax now looks like this:
GGRAPH
  /GRAPHDATASET NAME="graphdataset" VARIABLES=jobcat
    MAXIMUM(salary)[name="MAXIMUM"]
    MINIMUM(salary)[name="MINIMUM"]
    PTILE(salary,25)[name="PTILE25"]
    PTILE(salary,50)[name="PTILE50"]
    PTILE(salary,75)[name="PTILE75"]
    MISSING=LISTWISE REPORTMISSING=NO
  /GRAPHSPEC SOURCE=INLINE.
BEGIN GPL
  SOURCE: s=userSource(id("graphdataset"))
  DATA: jobcat=col(source(s), name("jobcat"), unit.category())
  DATA: MAXIMUM=col(source(s), name("MAXIMUM"))
  DATA: MINIMUM=col(source(s), name("MINIMUM"))
  DATA: PTILE25=col(source(s), name("PTILE25"))
  DATA: PTILE50=col(source(s), name("PTILE50"))
  DATA: PTILE75=col(source(s), name("PTILE75"))
  GUIDE: axis(dim(1), label("Employment Category"))
  GUIDE: axis(dim(2), label("Current Salary"))
  SCALE: cat(dim(1), include("1", "2", "3"))
  SCALE: linear(dim(2), include(0))
  ELEMENT: interval(position(region.spread.range(jobcat*(MINIMUM+MAXIMUM))),
    shape(shape.ibeam))
  ELEMENT: point(position(jobcat*MINIMUM), label(MINIMUM), transparency.exterior(transparency."1"))
  ELEMENT: point(position(jobcat*MAXIMUM), label(MAXIMUM), transparency.exterior(transparency."1"))
  ELEMENT: point(position(jobcat*PTILE25), label(PTILE25), shape(shape.plus))
  ELEMENT: point(position(jobcat*PTILE50), label(PTILE50), shape(shape.plus))
  ELEMENT: point(position(jobcat*PTILE75), label(PTILE75), shape(shape.plus))
END GPL.
This gives a chart that looks like this:
[caption id="attachment_3814" align="alignnone" width="625"]
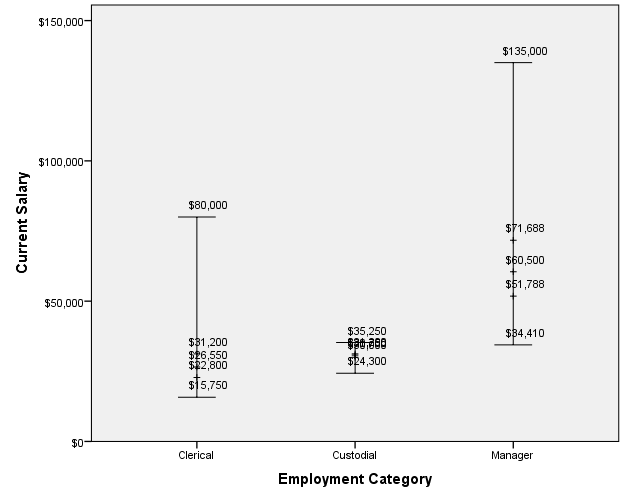
High-Low chart with added percentiles and labels[/caption]
This is the chart I'm looking for, but the labels are a bit difficult to read. To make the labels a little easier to read, I'm going to apply a custom chart template to give them a light-grey background, and to move them to the right of the point. Rather than creating a separate template file for this, I'm going to use the "INLINETEMPLATE" keyword
1 of the /GRAPHSPEC subcommand to include only the pertinent part of the template. This changes the /GRAPHSPEC subcommand from this:
/GRAPHSPEC SOURCE=INLINE.
to this:
/GRAPHSPEC SOURCE=INLINE inlinetemplate="<addDataLabels styleOnly='true' labelLocationVertical='center' labelLocationHorizontal='positive'><style number='1' color='lightgrey'/></addDataLabels>".
This gives us our final chart that looks like this:
[caption id="attachment_3811" align="alignnone" width="625"]
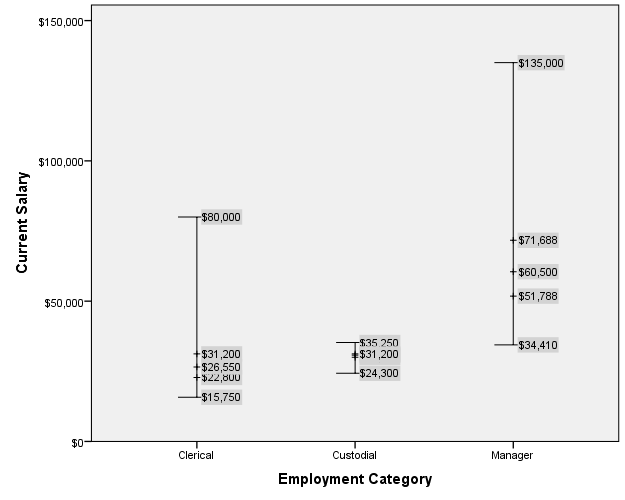
High-Low chart with added percentiles and customized labels[/caption]
1. The INLINETEMPLATE subcommand is not documented. It was added when the IGRAPH command was deprecated, to allow IGRAPH charts to be converted to GGRAPH syntax without toting around a separate chart template file.↩#GPL#SPSSStatistics#Usecases#Visualization