David Dwyer, @Jon Peck
Thank you, both. My main concern is around having the output arranged correctly - by default, the upper bound is placed as second column, as per below. Normally I edit this in the Editor tab after the graph is created, but that is not an option here, so I am not sure if there is a way to make adjustment to the input? Aesthetically I would like the numbers on the y-axis to have a thousands separator, but that is not essential if not possibsle with this graph type.
Thank you. 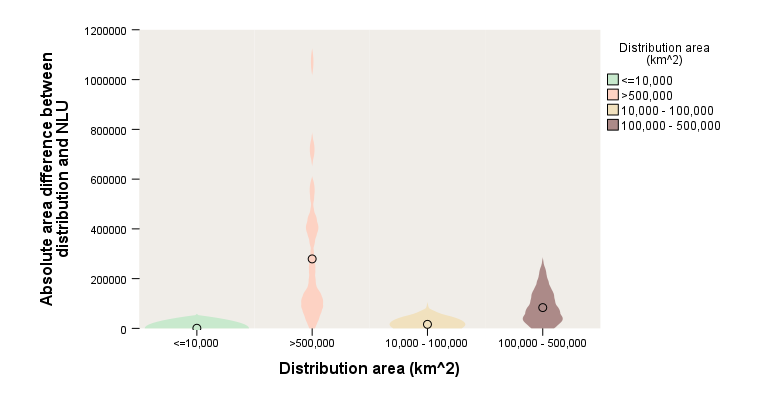
------------------------------
Ielyzaveta Ivanova
------------------------------
Original Message:
Sent: Fri May 19, 2023 06:49 PM
From: Jon Peck
Subject: Unable to edit violin plot output (SPSS 29.0.0.0)
It's true that the violin plot can't be edited, but you do have some choices when you create it. For example, you can color code the results by an additional variable, and you can change the color scheme and other style properties on the Options tab.
--
Original Message:
Sent: 5/19/2023 7:18:00 AM
From: Ielyzaveta Ivanova
Subject: Unable to edit violin plot output (SPSS 29.0.0.0)
Hi,
I am using SPSS version 29.0.0.0. One of the new features in this version is being able to create violin plots. However, I seem to be unable to bring up the editor screen after creating a violin plot in Graphboard? As in there is no double-click to activate feature for this output, which is not an issue for other graph types.
I am wondering if anyone has successfully edited violin plot outputs in this version?
Thank you.
------------------------------
Ielyzaveta Ivanova
------------------------------