The GGRAPH command is one of the few commands that can read data from a non-active dataset. This allows you to create charts where you overlay data from multiple datasets.
In the example below, I copied the Employee Data.sav file to my c:\temp directory. I then deleted all but the first 300 cases of data. Now I can compare the two datasets by doing the following:
- First I open both datasets, labeling them "EmployeeOrig" and "EmployeeNew".
- I pasted the syntax for a simple bar chart of counts using the "EmployeOrig" dataset.
- I added the DATASET keyword to the /GRAPHDATSET command, pointing it to the "EmployeeOrig" dataset.
- I copied this /GRAPHDATSET command and pointed the second graph dataset to the "EmployeeNew" dataset.
- In GPL, I added a new SOURCE statement, new DATA statements for the second dataset, and a new INTERVAL statement.
- Note I modified the second interval element to have an ibeam shape, and colored it red.
GET  FILE='C:\temp\employeeNew.sav'.
DATASET NAME EmployeeNew WINDOW=FRONT.

GET  FILE='C:\Program Files\IBM\SPSS\Statistics\23\Samples\English\Employee data.sav'.
DATASET NAME EmployeeOrig WINDOW=FRONT.

DATASET ACTIVATE EmployeeOrig.

GGRAPH
  /GRAPHDATASET NAME="graphdataset" DATASET="EmployeeOrig" VARIABLES=jobcat COUNT()[name="COUNT"]
  /GRAPHDATASET NAME="graphdataset2" DATASET="EmployeeNew" VARIABLES=jobcat COUNT()[name="COUNT"]
  /GRAPHSPEC SOURCE=INLINE.
BEGIN GPL
  SOURCE: s=userSource(id("graphdataset"))
  SOURCE: s2=userSource(id("graphdataset2"))
  DATA: jobcat=col(source(s), name("jobcat"), unit.category())
  DATA: COUNT=col(source(s), name("COUNT"))
  DATA: jobcat2=col(source(s2), name("jobcat"), unit.category())
  DATA: COUNT2=col(source(s2), name("COUNT"))
  GUIDE: axis(dim(1), label("Employment Category"))
  GUIDE: axis(dim(2), label("COUNT"))
  SCALE: cat(dim(1), include("1", "2", "3"))
  SCALE: linear(dim(2), include(0))
  ELEMENT: interval(position(jobcat*COUNT), shape.interior(shape.square))
  ELEMENT: interval(position(jobcat2*COUNT2), shape.interior(shape.ibeam), color(color.red))
END GPL.
This gives the following chart:
[caption id="attachment_3997" align="alignnone" width="626"]
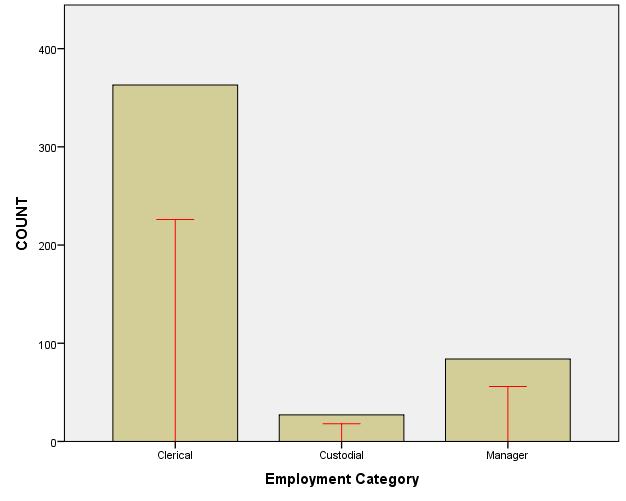
Overlay of data from two datasets[/caption]
Note that split files are not supported when graphing from multiple datasets, and you can't filter or weigh cases in the non-active dataset. Also note that if datasets have different value labels (e.g. "3" is "manager" in dataset 1, while "3" is "boss" in dataset 2), the category will be labeled with the value from the last DATA GPL statement.
#SPSSStatistics#Visualization