Hi Brennan,
Thanks for the info. Thanks for proposing the idea portal. The display as stacked percent chart is already off in my diagram. There are percentages appearing on the y axis, since I have set the blocks in the stacked chart to be represented as percentages within the fileds.
What I actaully want is the value of the x-axis of each stack printed underneath.
Kind regards,
Rizwan
------------------------------
Rizwan Iqbal
------------------------------
Original Message:
Sent: Thu April 28, 2022 10:49 AM
From: Brennan Fox
Subject: Summed up values underneath stacked bars in Marimekko widget without using a KPI or a Summary widget
Hi Rizwan, thanks for the question!
The particular solution of displaying summary values along the x-axis is not currently available. You're welcome to add that idea to our Ideas portal. Our product team will review it for future roadmap considerations.
For the time being, would toggling the property 'Display as stacked percent chart' OFF to display the scale in values be an acceptable alternative?
I've attached a screenshot showing an example of what that looks like - it could give the people using your dashboard a sense of the total values
------------------------------
Brennan Fox
Product Quality @ IBM Cognos Analytics with Watson
Original Message:
Sent: Wed April 27, 2022 04:18 AM
From: Rizwan Iqbal
Subject: Summed up values underneath stacked bars in Marimekko widget without using a KPI or a Summary widget
I am opening this topic again (https://community.ibm.com/community/user/businessanalytics/communities/community-home/digestviewer/viewthread?GroupId=3061&MessageKey=c5e63679-c748-4eb0-a2dd-6ffad88f636b&CommunityKey=6b10df83-0b3c-4f92-8b1f-1fd80d0e7e58&tab=digestviewer) and would like to know whether there is any improvement done to the marimekko widget to accomodate summed up values of each stacked bar underneath, instead of using KPI or Summary widget underneath? The summary or KPI widget works, but when the visualization changes, these widgets stay wide fixed underneath other stacks. Is is possible to link the summary/ KPI widget to change in shape according to the change in stacked bars in Marimekko, provided it is not possible to refelct summed up values of each stack in Marimekko.
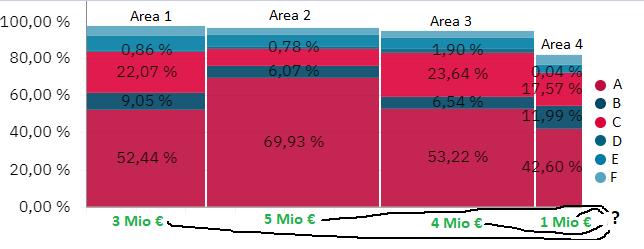
As seen in the above diagram, I would like to know how to get the values printed in green above (3 Mio €, 5 Mio €) underneath each stacked bar in marimekko.
--------------------------------
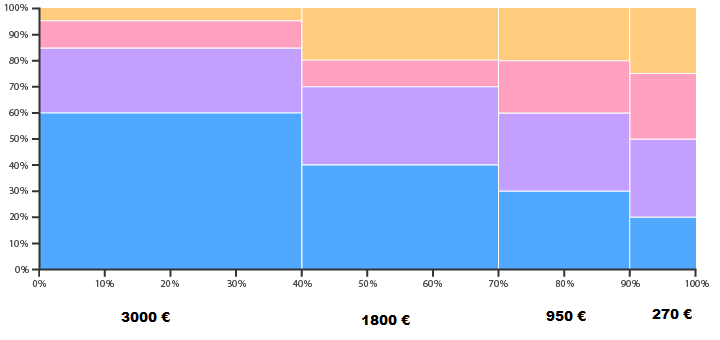
I have difficulties in printing the values on the x-axis of a summed up variable in a Marikmekko diagram using Cognos Analytics. For example, presently the diagram prints values in x axis in percent (a diagram as an example below), however, I want the total of each block to be printed below it, and not the percentage value as shown below (of course, I know to disable the percentage value in the tool). Say for the left stack 3000 €, the one right to it must carry 1800 € etc. How can this be done in the diagram? Any clue please? I am very new to Cognos and dashboarding.
Thanks for your support in advance.
Best regards,
Rizwan
------------------------------
Rizwan Iqbal
------------------------------
#CognosAnalyticswithWatson