In this article, I will introduce practices for developing and analyzing a process heat map in IBM Blueworks Live. A process heat map is usually a high-level process blueprint that provides an overview of a number of lower level processes. It is used to determine areas of focus for further process analysis and improvements.
In my previous articles, I introduced custom properties , enumerations and the Templates library. These concepts are used in creating the heat map in this article.
In this article, I will introduce the following features in IBM Blueworks Live:
- how to develop a heat map of potential process improvement areas using some custom properties
- how to use the Analyze mode to highlight process improvement areas based on property values
Develop Heat map
A process heat map is usually a high-level process blueprint that provides an overview of a number of lower level processes. For example, if you have developed a process framework (Designing a process framework) with a starter process blueprint to represent your process landscape, you can use this to develop a heat map of your inventory at the top level.
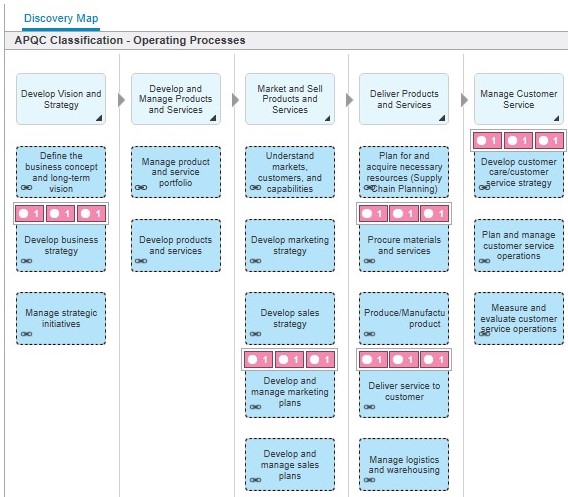
You can use any high-level process blueprint to develop a process heat map. In this posting, the referenced process blueprint, “APQC Classification – Operating Processes”, comes from the Templates library in IBM Blueworks Live. This process blueprint has 18 associated sub-processes. The process blueprints were provided by the American Productivity & Quality Center (APQC)*.
To develop the heat map, first determine the key indicators that align with your process goals. For example, if you are intent on reducing pain points in processes, you could capture Problems for each process in your process blueprint and then use the heat map to select the processes that have the most, or most severe and frequent, Problems.
If you are aiming to identify and prioritize improvement areas for business impact, you could use Benefit, Cost, and Volume as indicators. These indicators can be used to determine whether a process is worthwhile considering for improvement and potentially even automation. Benefit and Volume are not pre-defined properties in IBM Blueworks Live, but if you have administrator rights, you can create them as custom properties to use in Process Blueprints. Note: Cost is already a numeric property in IBM Blueworks Live. You can use this property to provide a precise cost value, such as a price, or you can create a Cost Level custom property to provide a high-level
indicator of cost. Creating custom properties such as these is discussed in a previous posting about
Configuring Custom Properties.

A heat map is best viewed in the “Discovery Map” view. Since a heat map is a high-level evaluation to identify processes based on a small set of key indicators, the Discovery Map is used as the view to facilitate analysis with its condensed perspective of the process landscape.
 Once you have your process blueprint selected and chosen indicator properties, you can update each Activity in the process blueprint to assign values for these properties through the Details tab.
Your heat map is now ready for some initial validation and analysis.
Review the process heat map
Once you have entered the appropriate values for the key indicator properties in your process blueprint, you can use the Analyze mode to review the heat map to see which processes have been identified as potential candidates for further improvements, i.e. with the highest levels of Benefit, Cost, and Volume.
 In the Analyze mode, you can choose one or more properties to display at the same time. An icon will be displayed on each Activity in the process blueprint that has one or more values defined for the selected property. The icon key is displayed on the sidebar to the left of the Analyze window.
|
TIP: When you are entering property values in the Details for many Activities, you can use the Analyze Mode to quickly validate which Activities have been updated.
|

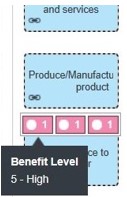
For simplicity, in the example process above, only 5 Activities representing different processes had values defined for the Benefit, Cost and Volume properties. In your process, you would likely have values defined for these properties on all the Activities. You can see these values by hovering over the icon or viewing them in the sidebar to the left.
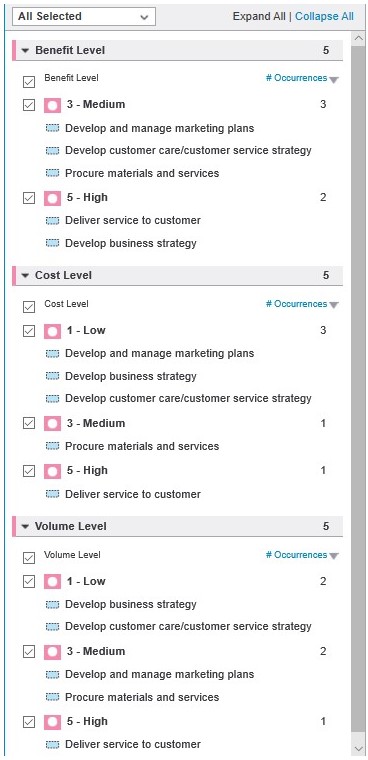
The Analyze mode side bar on the left lists of all the values that are assigned to Activities (and at the overall process level, too) for each displayed property. If a property is an enumeration, there may be values defined for the property that are not assigned to any Activities. These values that are not assigned will not be displayed.

|
TIP: You can use this view to quickly identify all the activities with a particular value for one property.
|
For example, in the example above, you can quickly see from the Analyze sidebar that no activities have the 1- Low value for Benefit (an enumeration value that is already defined, but not assigned to any Activities in the process) as 1-Low is not displayed in the list of values for Benefit Level. You can also see that 3 Activities are defined with a Medium level of Benefit Level.
You can further refine the Analyze view by selecting or de-selecting specific values in the sidebar for each property. This will reduce the view to display icons only on the Activities that have those selected values defined for the properties. By limiting the display in the Analyze mode to specific values for each property, you can quickly isolate and highlight processes with key property values within the heatmap.
In the figure below, only the High value has been selected to be displayed for each of the custom properties. There is only one Activity, “Deliver service to customer”, which had all High values set for the three custom properties. This activity would likely be a top priority candidate for process improvement efforts, as it has the following characteristics:
- High Benefit – it is a key process that provides strong benefit to the business, so it is a good candidate to ensure it is performing at its peak
- High Cost – it is an expensive process, so there is likely an opportunity to reduce cost, even by a small amount
- High Volume – it is a high volume process, so even small improvements to each instance of the process will have a large overall impact

In this article, I reviewed the following features in IBM Blueworks Live:
- how to develop a heat map of potential process improvement areas
- how to use the Analyze mode to highlight process improvement areas based on property values
Check back soon for my next articles about
how to setup up types for Input and Outputs in the Glossary in IBM Blueworks Live.
* THE APQC PROCESS CLASSIFICATION FRAMEWORK (PCF)® was developed by non-profit APQC, a global resource for benchmarking and best practices, and its member companies as an open standard to facilitate improvement through process management and benchmarking, regardless of industry, size, or geography. The PCF organizes operating and management processes into 12 enterprise level categories, including process groups and over 1,000 processes and associated activities. To download the full PCF or industry-specific versions of the PCF as well as associated measures and benchmarking, visit www.apqc.org/pcf.
#Featured-area-1#Featured-area-1-home#BlueworksLive#processoptimization#processmapping