Introduction
This post aims to introduce some of the health status monitoring improvements that have been delivered as part of 10.0.5.3. The aim of the improvements, along with this article, is to help customers get better visibility into the health of the system, as well as be able to monitor the same.
This post was co-edited along with my colleague Niraj Pandey.
Improvement to Management Cluster status
The first improvement that we want to discuss is for the Management Cluster. There are 2 main improvements that we want to highlight here.
The first one is that during installs you have much better clarity on how the installation is progressing. The image below is a screenshot of CR status.conditions for ManagementCluster CR during installation:
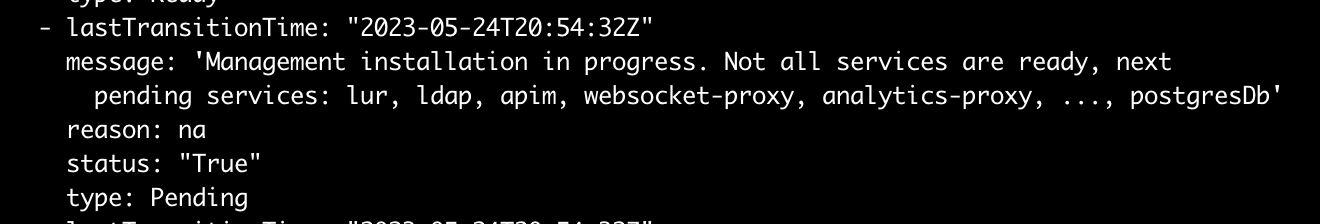
The message keeps updating as the installation proceeds, for example later on we see:
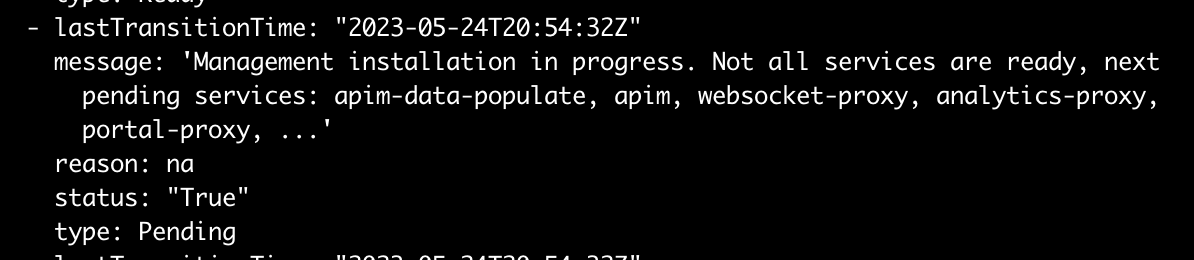
The list of pending services is sorted, so you can focus on the ones being shown if the installation gets stuck. As the messages get updated, they also give you an idea that the installation is progressing well.
Upgrades will also have similar messages that detail the various pods/services.
An example of a message during an upgrade:
Management instance being upgraded. Not all services are ready, next pending services: analytics-proxy, apim, client-downloads-server, juhu, natscluster, ...
In addition to the above, there is a MESSAGE column at the top level (
kubectl get mgmt -n <namespace>) which gives an idea of the overall state of the system.
If the management cluster is running fine, you will see something like:
Some other examples of these top-level messages are:
- During installation: Management installation in progress - see status condition for details
- During upgrades: Management upgrade in progress - see status condition for details
- If some pods/services are not ready: Some services are not ready - see status condition for details
The message will point the user to look at status conditions to get more details.
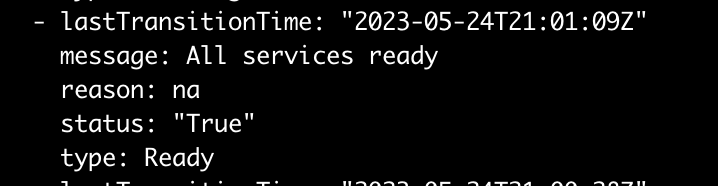
In my case, as my installation finishes, the status condition is also updated:
Improvement to API Connect Cluster status
There are similar improvements to the API Connect Cluster resource also.
The first improvement is the status.conditions for APIConnectCluster CR gives much more details, especially during installation and upgrades which should help you quickly see why your installation or upgrade is pending or stuck. Or if your APIConnectCluster CR gets into a Warning/Error state, it will also help you know the issue much faster.
Some examples of the message inside CR status.conditions:
- During installation: APIC installation in progress. Not all services are ready, pending services: analytics, configurator, dashboard, gateway, management, oidc-binding, portal
- During upgrades: APIC instance being upgraded. Not all services are ready, pending services: analytics, gateway, management, portal
- Normal usage: All services ready
A new MESSAGE is also introduced in APIConnectCluster CR similar to ManagementCluster CR that gives the overall health of the system (kubectl get apic -n <namespace>), for example:
Some other examples of these top-level messages are:
- During installation: API Connect cluster installation in progress - see status conditions for details
- During upgrades: API Connect cluster upgrade in progress - see status conditions for details
- If some subsystems/services are not ready: Not all services are ready - see status conditions for details
The top-level message will point to status.conditions inside the CR for details.
Use of Events for status updates
In addition to status improvements, beginning with 10.0.5.3, API Connect now also emits Kubernetes events for any changes to status conditions for any subsystem (ManagementCluster, PortalCluster, AnalyticsCluster, and GatewayCluster) and API Connect Cluster CR.
For example, for ManagementCluster, I can do a describe (kubectl describe mgmt <ManagementCluster CR Name> -n <namespace>) of the CR and I will see events generated during installation (removed some rows for brevity):
OpenShift has a much nicer experience where you can go to the Events tab of a CustomResource to get events for the same.
Example events for ManagementCluster on OpenShift UI:

Example of events for API Connect Cluster resource on OpenShift UI:

If events are generated when CR status is in Warning/Error/Blocked, it generates Warning events. This is true when running on both Kubernetes and OpenShift. The following screenshot from OpenShift UI shows an example of a Warning Kubernetes event being generated:

The events are especially useful to know updates to status conditions if they happen continuously, or if any changes to status conditions are happening. It can also help if you think the CR status is flip-flopping for any reason.
Note that on Kubernetes the default retention period for events is 1 hour, while on OpenShift it is 3 hours. These values can be changed on an installation. Additionally, you can also set up notifications and alerts based on Kubernetes events, see the "Additional Material" section for an external blog around doing so - searching online you can find more ways to set up notifications and alerts based on Kubernetes events.
Conclusion
We have tried to showcase some of the improvements we have made in 10.0.5.3 that can give you better visibility into your API Connect installation. Our intent is to keep improving so you get better visibility and more actionable feedback. As we make additional improvements, we will post additional articles about those.
Please do let us know if you have any feedback on this article, and/or if you would like additional articles around the area.
Additional Material
Some additional reading material if you are interested:
#APIConnect