Quick Question:
How does an APIM developer see latency times for specific assembly policies?
As customers are delving into performance of their APIs, they often want to know how the overall transaction latency breaks down for the various assembly policies.
The Question
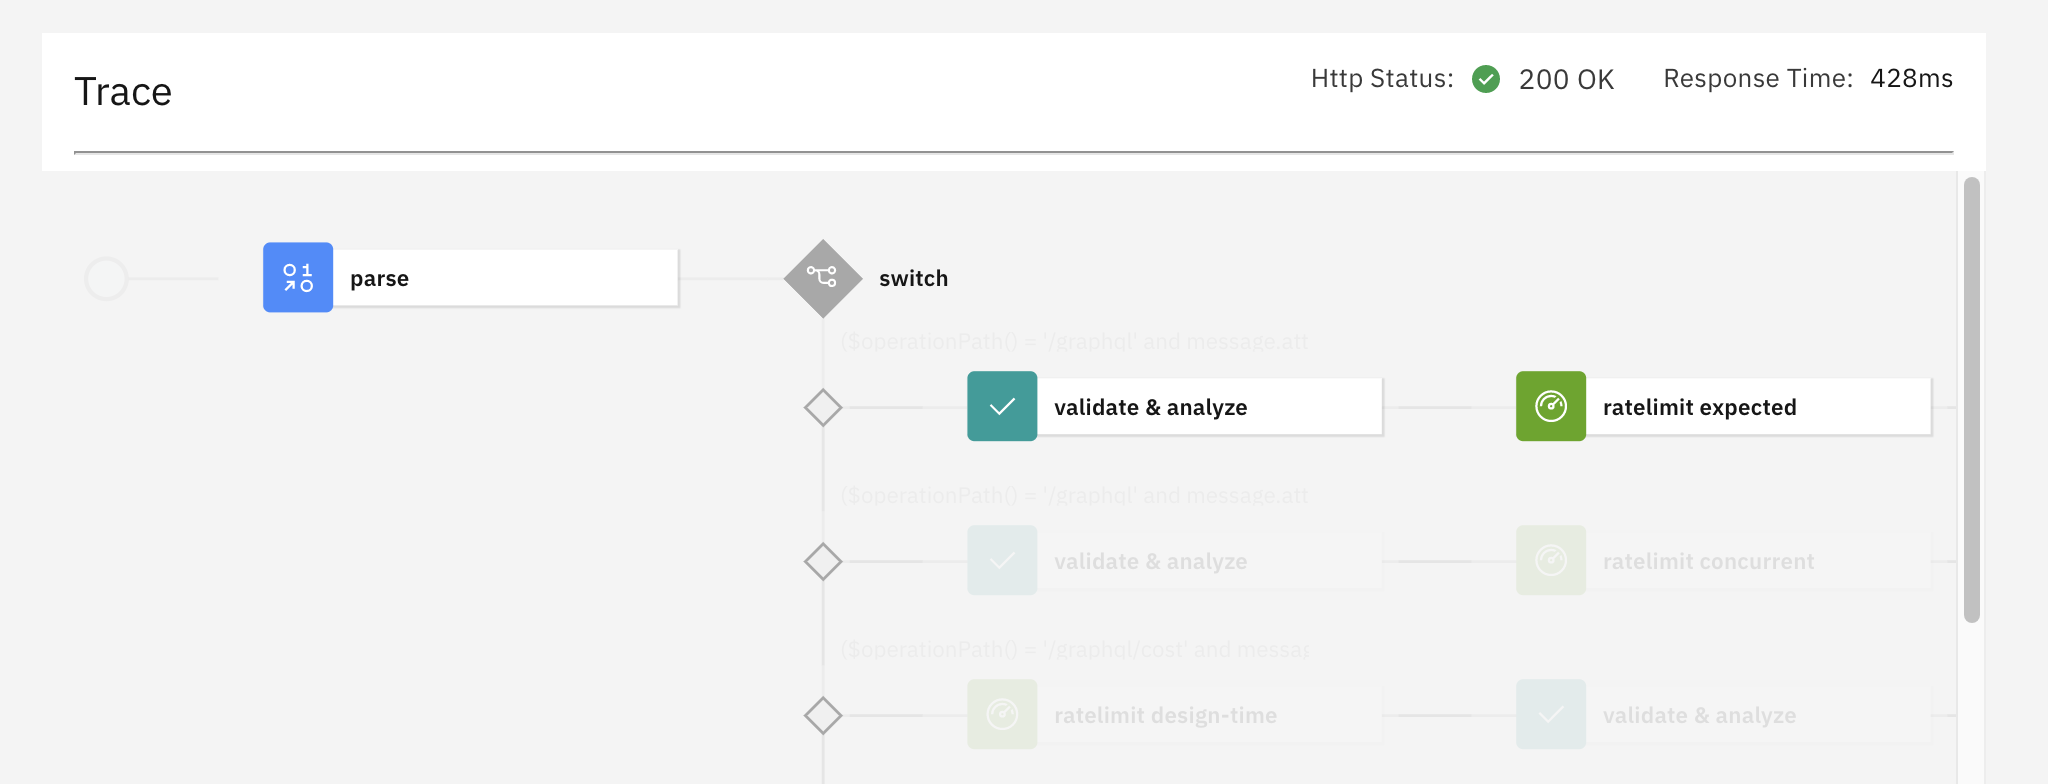
APIC allows you, an API Developer, to easily develop an API including an Assembly full of diverse capabilities. This makes it easy to design and author the enforcement of your API. As you work on how the API will actually respond to requests, you try it out — in APIC v10 you try it in the API Manager's new Test Tab. After sending a test transaction to the gateway, you can see a Trace of exactly which path in your assembly was taken on the gateway. On the top of the Trace you see the HTTP Status code returned and the overall latency of the transaction.

Here we see that the transaction took a total of 428 milliseconds, but where was that time going?
We see a number of Assembly Policies - how much time did each one take?
Note for DataPower admins: This question is specifically targeted to development time of the API. All of the data you can get here is also available for the DataPower admin who has full admin rights to the gateway, but this blog post is not showing how the admin can retrieve this information. It is documented in the Knowledge Center. If you are interested in that path, please let me know.
Note for experienced DataPower developers: The extended latency log is also available in the same details screen. As usual, it requires understanding the latency codes, as well as knowing which assembly policies ran in which order. Sometimes that's the right way to go, but this blog post focuses on the simple path that is usually what the API developer is looking for. If you want more about the extended latency path, please let me know.
The Answer
It's easy to find the latency for one of the assembly policies in the main assembly of the API that you're developing:
- Step 1: In the Trace, click on any assembly policy that actually ran in this transaction (and is therefore not greyed-out). This will reveal the details, below the trace UI view, specific to your chosen assembly policy.
- Step 2: Below the Trace, look at the JSON data, and find value of the
latency key.

Look at the last line in the screenshot - latency: 4- that means that the Parse Policy finished at 4ms into the transaction on the gateway. This is in keeping with the way that extended latency logs have always worked on DataPower: you always see when in the transaction this policy completed.
But when did it start?
- Step 3: Find the latency of the previous policy. Subtract, and you have your policy's latency.
Special Case: The first assembly policy
If you happen to be looking at the very first policy, then the prior policy is in the preflow and not visible in the Trace UI of the Assembly. Instead, choose Full trace in the assembly policy dropdown and find the latency of the last action in the preflow. In this case, note that "policies" are referred to as "actions". It's pretty straightforward:

The security action in preflow finished at 3ms, and the parse finished at 4ms, so this parse took 1ms to run. That means that avoiding the parse isn't going to have a significant impact on our 428ms network timing.
Conclusion
Obviously this is not giving you accuracy to less than a millisecond, but it's a great way to start profiling to see where time is going in your assembly.
Note: These pictures are from APIC v10.0.1.1, earlier and later versions might have differences in the UI, but you get the idea.
#apic#APIConnect#apigw#DataPower#DataPowerGateways#debug