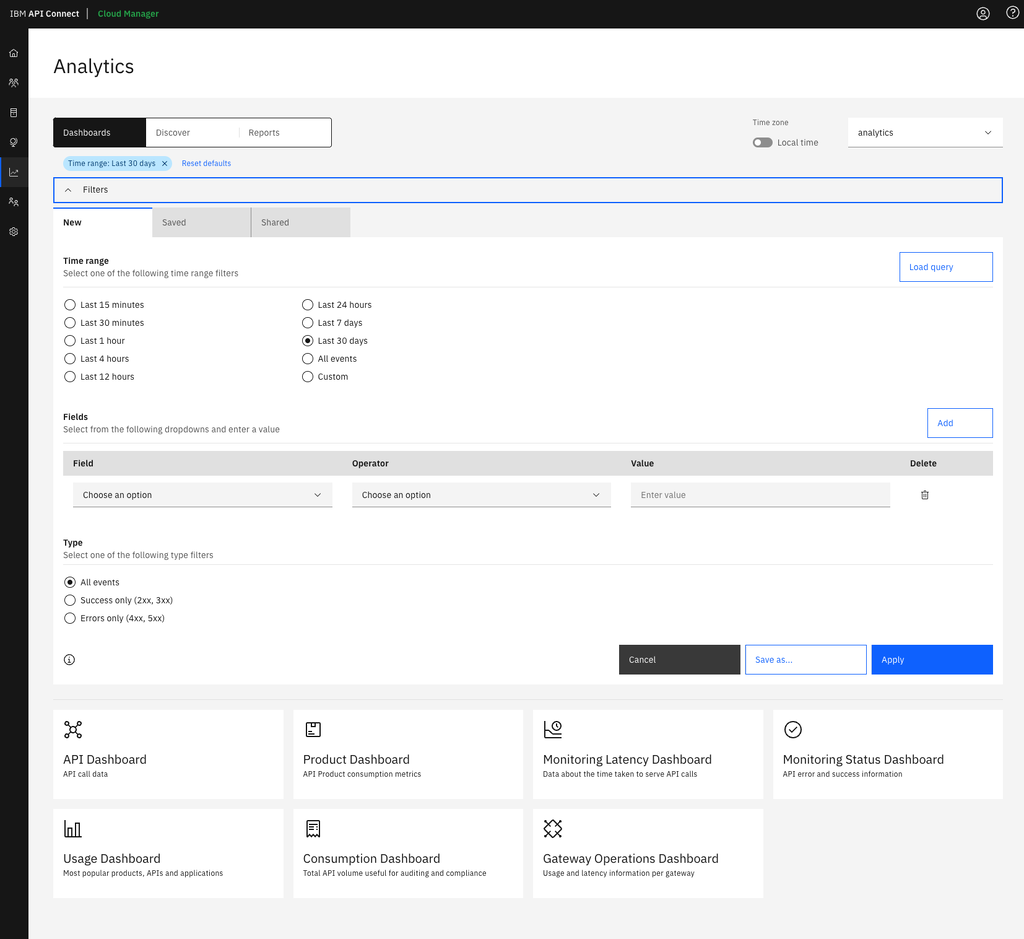
APIC 10.0.5.2 introduced the ability to save analytics queries. These queries can be built up of numerous complicated filters on specific attributes of the API events along with timeframe, status_code, etc. It is possible to do negative matches, regular expressions, starts with, ends with and even use CIDR notation for netmask based IP queries. The ability to save and then reuse these queries allows Analytics users to quickly reload specific searches. The query applies to both the Discover view of raw API events for ease of problem determination and also the Dashboards to visually browse the data.

New in APIC 10.0.5.3, users can now share those saved queries with other users. The saved queries are created at a specific scope (such as a specific catalog, space or provider organization) and can be shared with all users in that scope. This allows easy reuse of sophisticated queries within the team responsible for a given catalog, space or provider organization.
There is no cascading of queries to lower scopes, they are only shared with the specific scope they exist in, this is intentional to avoid security concerns with queries from higher scopes being accessed at lower levels. In many cases they wouldn’t apply at the lower scope because they would be filtering on attributes only appropriate at the higher level.
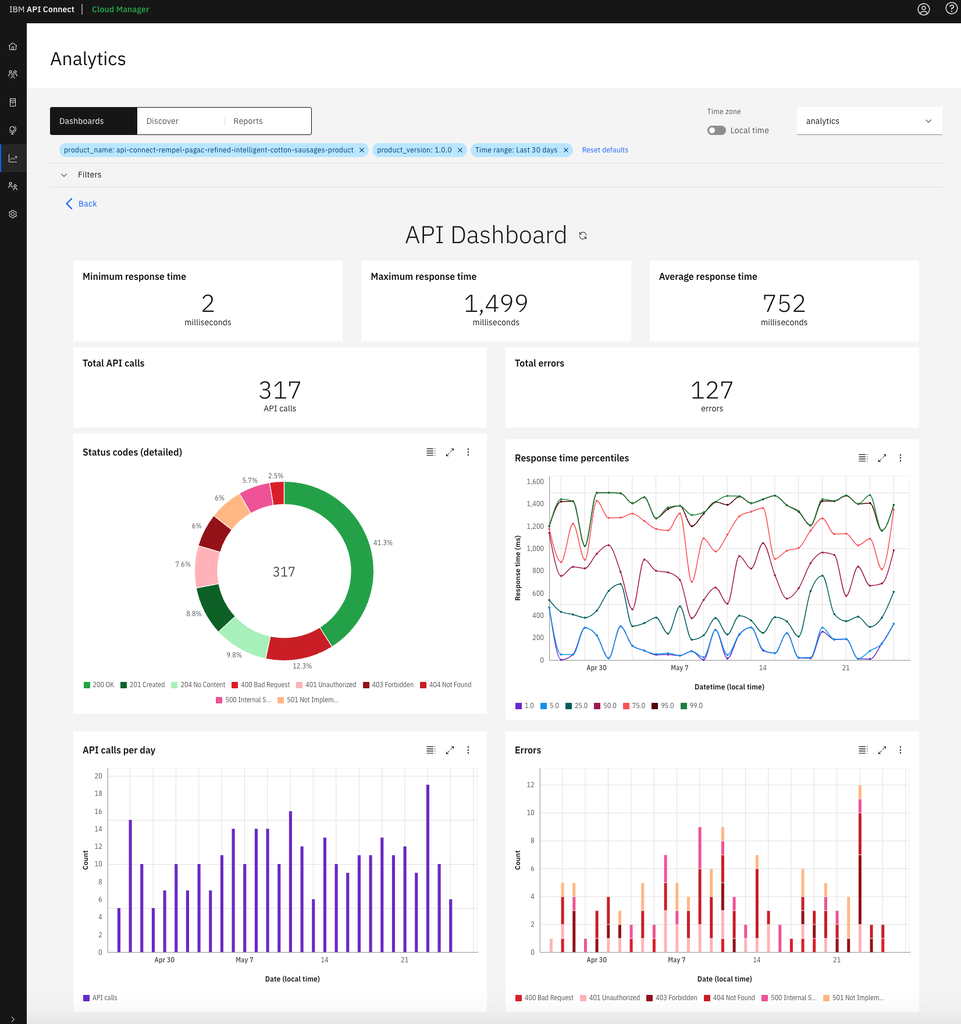
In previous APIC releases there was the ability to create custom dashboards. The majority of those custom dashboards used standard charts but hardcoded the selection criteria into the dashboard. For example, showing API calls to a specific product over the last 30 days. APIC 10.0.5.3 achieves the same end goal via a different mechanism - the charts that are shown on a dashboard are not customizable but it is easy to change what data is shown on them. If we take the earlier example of showing all API calls to a specific product over the last 30 days this would be achieved by simply creating a query in the UI that specifies the last 30 days as the time frame and then adds field filters on the product_name and product_version fields with the appropriate values. That can then be saved and shared with all users at that particular scope. The API Dashboard would then show the calls to that specific product, and looking at the other dashboards you could see how the calls to that specific product fared in terms of status code, response time, bytes sent and received, along with other attributes on the different Analytics Dashboards.

There are lots more analytics features coming soon, if you have specific requirements let us know by raising a requirement here: https://integration-development.ideas.ibm.com/
#APIConnect #analytics