IBM Apptio

Apptio

A place for Apptio product users to learn, connect, share and grow together.


#Aspera
#Apptio
#Automation
#FinOps
#Apptio
#ITAutomation
 View Only
Expand all | Collapse all

Show Metric Dollars (Drill Chart)

  • 1.  Show Metric Dollars (Drill Chart)

    Posted 05/11/16 04:52 PM

    Good afternoon,


    I am attempting to create a report and am not finding a way to build it. Looking for ideas.


    Problem:

    How to build a chart and report which show the actual costs by cost pool for IT Towers? To clarify, the issue is that the current out of the box report shows the costs, per the cost model by cost pool for IT Towers; however, the cost model defines cost which is greater than what I need to show in my current report. I need to exclude two of the defined drivers to show only the actual cost.


    The cost model drivers are a combination of four drivers (actual variable, actual fixed, fixed encumbrances, variable encumbrances). I need to show only actual costs (actual variable + actual fixed), not the modeled cost metric. A calculated metric has been built where Actuals = Cost (fixed + variable) - Encumbrances (fixed + variable). The issue is that when I am building the chart to show cost pool actual $ by IT Resource Tower and Cost Pool, the calculated metric (actuals) cannot be used as a value.  The error message shows "Unsupported combination". Is there a way to show actual $, rather than the modeled metric cost?


    Thank you for any ideas.


    Deb


    #CostingStandard(CT-Foundation)


  • 2.  Re: Show Metric Dollars (Drill Chart)

    Posted 05/12/16 01:07 PM

    Two points which might help:


    1. Calculated metrics (as opposed to model metrics) will not work in tables locked to two model objects, because a calculated metric has no way of knowing how to allocate itself from one object to the other.


    One workaround though is to insert a new report table column which uses the same formula as the calculated metric's formula.


    For example: the calculated metric called Cost YTD won't work in a table locked to both Cost Source and IT Resource Towers. But since Cost YTD = YearToDate(Cost), we can just insert a new column into the table (already locked to two objects) such as YTD Cost = YearToDate(Cost). Since the report table knows how to calculate Cost, the new column will work.


    2. Individual allocation lines from a model can be used directly in report table column formulas. Each object's inbound allocations are individually listed and available from the Calculations perspective in the ad hoc query configuration dialog.


    For instance, here are the inbound allocations for the IT Resource Towers object in my Cost model:
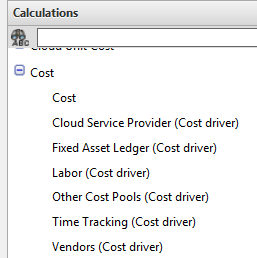
    calculations_cost.PNG

    ...these can be combined or mathematically manipulated just like any other metric such as Cost.


    #CostingStandard(CT-Foundation)


  • 3.  Re: Show Metric Dollars (Drill Chart)

    Posted 05/13/16 09:36 AM

    Thank you for the response.  The option to insert a new column is greyed out for me. How do I add a new report table column to a chart?


    #CostingStandard(CT-Foundation)


  • 4.  Re: Show Metric Dollars (Drill Chart)

    Posted 05/13/16 09:40 AM

    You may want to try:

    1. Switch chart back to table (Ribbon > Ad Hoc > Table).

    2. Remove all column names from Columns section in ad hoc query (AHQ) configuration.

    3. Add the new table column (Ribbon > Data > Insert > Insert formula column).

    4. Add back the column names to Columns section in AHQ configuration.

    5. Switch table back to chart.


    #CostingStandard(CT-Foundation)


  • 5.  Re: Show Metric Dollars (Drill Chart)

    Posted 05/13/16 09:45 AM

    I have completed the steps below, as well as added a new chart and before adding any columns via the AHQ Configuration, viewed as a table; however, the option to add a new column is greyed out. Could it be the version or something I need to do differently?


    Kind regards,


    Deborah Krueger, Functional Analyst III - Enterprise

      Information Technology | Business & Financial Services

      UAB | The University of Alabama at Birmingham

      CEC 140 | 1530 2nd Avenue South | Birmingham, AL  35294-2080

      Phone: | Cell 515.707.534 | Fax 205.975.9211 | dkrueger@uab.edu<mailto:dkrueger@uab.edu>


    #CostingStandard(CT-Foundation)


  • 6.  Re: Show Metric Dollars (Drill Chart)

    Posted 05/13/16 10:05 AM

    The column insert option will be grayed out for completely empty tables.

    Try first adding an item to either the Rows or Values areas in the ad hoc query configuration dialog.


    #CostingStandard(CT-Foundation)


  • 7.  RE: Re: Show Metric Dollars (Drill Chart)

    Posted 03/11/21 02:23 PM
    Hello,

    Is this function still work?

    We're trying to drill down to a calculated metric. I've added the modeled metric (Cost) in this case and hidden it.  The table did drill down at first but hasn't since. 

    Regards,

    Jay


  • 8.  RE: Re: Show Metric Dollars (Drill Chart)

    Posted 03/11/21 02:56 PM
    Pinging @Debbie Hagen and @Jenny Goodwin to see if they know 😊​​


  • 9.  RE: Re: Show Metric Dollars (Drill Chart)

    Posted 03/11/21 03:08 PM

    Thanks Jenny.


  • 10.  RE: Re: Show Metric Dollars (Drill Chart)

    Posted 03/11/21 03:45 PM
    Most welcome - I know y'all are on a bit of a timeline 😉😁😎


  • 11.  RE: Re: Show Metric Dollars (Drill Chart)

    Posted 03/18/21 07:29 PM

    Hi Jay,
    Sorry, I missed this until now.  I don't know off the top of my head.  I don't remember reading/hearing that it doesn't work anymore.  Let me investigate.  Let me know if you already got an answer from someone else.

    Cheers,

    Deb


    ------------------------------
    Debbie Hagen
    Apptio
    ------------------------------


  • 12.  RE: Re: Show Metric Dollars (Drill Chart)

    Posted 03/19/21 02:43 PM

    Hi again Jay,

    The feedback I got is that the restriction that  detailed in his response is still valid.  A calculated metric will not work in a report built off of two (or more) objects.  The way around this would be to create the formula within the table or, if you're planning to use this formula more frequently, publish that formula to a perspective.

    Have you tried that?  

    Cheers,

    Deb


    ------------------------------
    Debbie Hagen
    Apptio
    ------------------------------


  • 13.  RE: Re: Show Metric Dollars (Drill Chart)

    Posted 03/23/21 07:34 PM

    Hi Debbie,


    I haven't tried that as yet. I'll give it a shot and see what happens.


    Thanks so much.


  • 14.  RE: Re: Show Metric Dollars (Drill Chart)

    Posted 03/30/21 07:01 PM
    Hi Jay,
    Did it work?

    ------------------------------
    Debbie Hagen
    Apptio
    ------------------------------


  • 15.  RE: Re: Show Metric Dollars (Drill Chart)

    Posted 04/03/21 02:29 AM
    We find ourselves putting logic in tables rather than in reports. It may have to do with the fact that we have learned to create and handle metrics more effectively 😜👀😎