IBM Apptio

Apptio

A place for Apptio product users to learn, connect, share and grow together.


#Aspera
#Apptio
#Automation
#FinOps
#Apptio
#ITAutomation
 View Only
  • 1.  Report filtering and grouping

    Posted 07/22/16 12:23 PM


    I have a nice report built that shows my capital projects and whether or not they are "at risk" based on a number of criteria.  The list is at the detailed level (one line per project).  I would like to be able to summarize that list up to a Portfolio level to use in a bar chart to show At Risk project counts by Portfolio, and also summarized to the top level to show one At Risk number as a KPI.


    Evaluating whether or not a project is At Risk is not done within the backing table, though, so it's not quite as simple as just grouping the table at the right level.  I had to use YTD and Annual functions to create synthetic fields in my report table in order to get the numbers I needed for comparing actual spend vs planned spend and then flagging the project accordingly.


    Ultimately, I end up with a report that looks something like this:
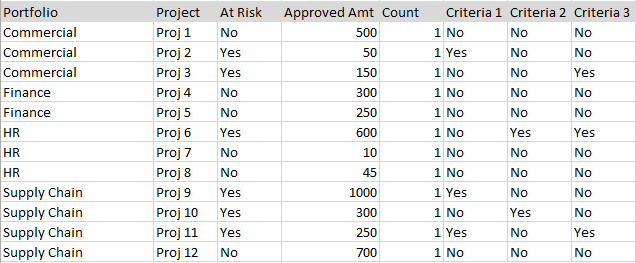
    where the Approved Amount is the total amount that the project is approved to spend, which can span multiple years; and the Project is At Risk if any of the 3 calculated criteria are Yes.


    For purposes of my At Risk report, I only care about projects that are >$100, so i want to be able to filter this table on At Risk=Yes, and Approved Amt>=100  and then summarize it by Portfolio so that it looks like this:

    However, as soon as I group by Portfolio, all of the amounts get summarized up into one number and then the filter is applied after the summarization.  Similarly, all three of the calculated criteria are summarized and the the At Risk column calculates based on the summarized criteria for the Portfolio.  So it summarizes the report first and then filters it, and it ends up looking like this instead:
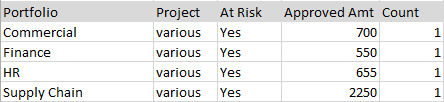
     

    What I need is to be able apply my filters to the lower level and still be able to report at the higher level.  Is there a way to do this? 


    #CostingStandard(CT-Foundation)


  • 2.  Re: Report filtering and grouping

    Posted 07/25/16 05:06 PM

    Hi James,


    Have you tried setting the value calculation to happen "before grouping" on your formula columns? The default value of "automatic" may not be working for you.


    #CostingStandard(CT-Foundation)


  • 3.  Re: Report filtering and grouping

    Posted 07/26/16 09:43 AM

    Where would I do this?  These are synthetic columns in a report, not in a data table/transform.  I don't see an option anywhere in the report configuration to be able to specify before or after grouping.


    #CostingStandard(CT-Foundation)


  • 4.  Re: Report filtering and grouping

    Posted 07/26/16 10:22 AM

    You're right, you would need to do this in a transform in order to get the order of operations in the correct sequence.


    #CostingStandard(CT-Foundation)


  • 5.  Re: Report filtering and grouping

    Posted 07/26/16 11:18 AM

    That's what I was thinking.  And that's where I'm stuck.  I can't build the calculations I need in a transform because they involve functions that can't be used in a data table (e.g. Annual and YTD).


    My use case is this: I'm looking at capital projects and flagging ones that are At Risk.  One of my determining factors for calling a project At Risk is if it has spent more than 10% of it's planned budget to date.  So I have what the project planned to spend and what it actually spent in a month in my transform table.  I need to roll these both up to Planned and Spend To Date numbers and compare them.  But I can't roll them up in a transform, so I do this in a report table, which works fine.  But then if I try to summarize it to a Portfolio level, I get the issue that caused me to create this thread.


    #CostingStandard(CT-Foundation)


  • 6.  Re: Report filtering and grouping
    Best Answer

    Posted 07/26/16 01:23 PM

    Ah, got it. Here are a couple of alternatives you can try.


    1) Do the comparison functions in calculated metrics, then pull those metric columns into your report and group it down.

    2) Do the comparisons in a hidden report table without the grouping. Use the data path from this table as the first argument in a LookupFromPath function on a second report table, where you then apply the grouping.


    I haven't tested either of these options for your specific use case. So let me know if I've missed anything critical in either of these approaches.


    #CostingStandard(CT-Foundation)


  • 7.  Re: Report filtering and grouping

    Posted 08/08/16 11:14 AM

    Just to close out the loop on this one... I ended up using your first alternative and doing my comparisons in calculated metrics.  It ended up being a little more work, but the end result gave me the functionality I needed, and in the long run, I think will be beneficial to be able to have those metrics available to pull into other reports.  So thanks, @John Adipietro, for your help on this!


    #CostingStandard(CT-Foundation)