Is there a way to create a waterfall chart that does not require users to enter explanations for variances, but rather the variances are defined within the data itself?
So for example, let’s say I’ve got 3 cost centers that totaled the following amounts in May 2015:
CC1: $100
CC2: $100
CC3: $100
In May 2016, they total:
CC1: $120
CC2: $90
CC3: $105
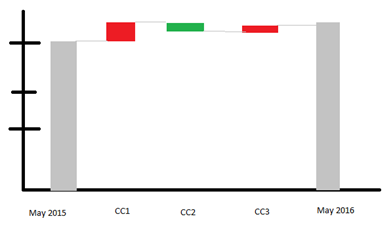
I want my waterfall chart to show a start of May 2015 at $300, my first waterfall is CC1 at +$20, second waterfall is CC2 at -$10, third waterfall is CC3 at +$5, and the end of the waterfall is May 2016 at $315.
So it ends up looking something like this (forgive the crudity of the picture… I just threw something together real quick in Paint LOL!):
I think I remember seeing something like this in a demo for ITPF at one point, but I'm not sure.