Hello George. I saw your note and wanted to ask if you have encountered this need
- we want to be able to see the previous years actuals as we move forward through 2021.
- i created a 2 yr forecast last month that contained 12 months of actuals for 2020, and 12 months of forecast for Jan - Dec 2021.
- there was a special selection at the bottom of the Create Plan, ...Forecast start period that allowed the forecast to start on "January (Year 2)".
we now have January actuals, and I want to create a forecast that has Jan - Dec 2020, plus Jan 2021 actuals, and then add Feb - Dec 2021 forecast.
Trouble is, there is no special start month called "February (Year 2)" to start the forecast.
Seems very limiting. I can't believe that we can do January into the new year, but not any of the other months of 2021.
Thoughts? Keith
Original Message:
Sent: 07-31-2018 13:41
From: George McElfresh
Subject: Re: Creating a Forecast
There are a few other things to be aware of when you start combining actuals and forecast. They make sense when you think about it but being aware of them ahead of time can help head off some user questions:
- Actuals create detailed rows in the expense view so the Other tab in expenses becomes a combination of separate rows with the actuals and separate rows with the forecast.
- For example, if your forecast now has actuals through June you'll see rows that look like this for 2018
| | JAN | FEB | MAR | APR | MAY | JUN | JUL | AUG | SEP | OCT | NOV | DEC |
| Forecast Rows | - | - | - | - | - | - | 100 | 100 | 100 | 100 | 100 | 100 |
| Actuals Rows | 75 | 65 | 90 | 80 | 85 | 90 | - | - | - | - | - | - |
- When you create your forecast, take time to think about the level at which you really need your actuals grouped by. The more grouping criteria you add, the more actuals rows it's going to generate. They can grow faster than Tribbles.
- The view of Actuals vs. Forecast in the Column Chart on the Summary screen throws people at first because for actuals months, they're equal. The previously forecasted amounts for those prior months still lives in the forecasts for those months.
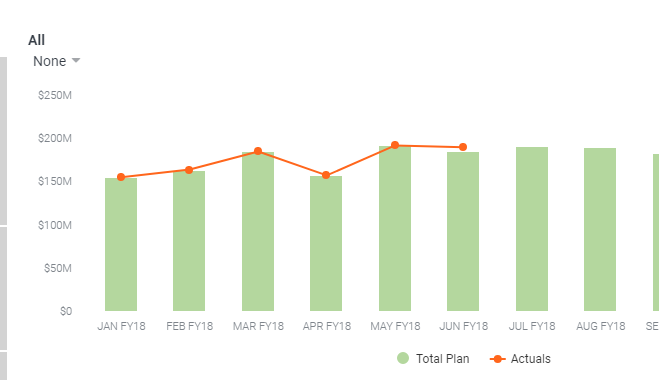
- Your group by selection on the Summary Screen will affect whether you see all of your actuals in this view or just a subset of them. If you're grouping by a dimension that is in your forecast, but not in your actuals, then there wouldn't be anything in Jan-June above. Highly recommended that you test different views when you move into actuals so that you fully understand the behavior and can explain it.
#ApptioPlanning(ITP/ITFMF)