IBM Apptio

Apptio

A place for Apptio product users to learn, connect, share and grow together.


#Aspera
#Apptio
#Automation
 View Only
  • 1.  Charting Question - Color Blindness

    Posted Fri March 27, 2015 08:14 PM

    We need to produce several charts for a manager that is color blind. This renders the colors used in our charts as impossible to read. Is there a way to change the shapes on the line, so that for a chart with three lines: one shows triangles, another circles and another squares? Would also like to get some suggestions around what options are available for producing charts that are not dependent on colors for discerning the different lines being graphed (dashes, broader lines). For those who have run across the situation, what option worked best? Thanks!


    #CostingStandard(CT-Foundation)


  • 2.  Re: Charting Question - Color Blindness

    Posted Tue March 31, 2015 04:03 PM

    I don't know how to set individual shapes, but you can specify the colors.  Typically colorblindness is between two colors.  If you used the color spec entry below, could you select colors that are more easily distinguishable?


    #CostingStandard(CT-Foundation)


  • 3.  Re: Charting Question - Color Blindness

    Posted Tue March 31, 2015 08:10 PM

    Thanks Richard. This is my understanding too. Setting shapes would definitely help people differentiate better. It sounds like a good candidate for Idea section.


    #CostingStandard(CT-Foundation)


  • 4.  Re: Charting Question - Color Blindness
    Best Answer

    Posted Wed April 01, 2015 04:04 PM

    Completely agree that shapes would help, but there is one trick I know of available with colorspec that may be useful.


    Most color blind individuals have a hard time differentiating between different colors, but can tell Darknesses/saturations of color. They can also usually detect an absence of color. Color spec supports the following colors:

    colorspec colors.png


    Black/Gray/lightGray/darkGray and white should look the same to everyone [except the blind].


    A color blind person is going to have alot of trouble differentiating between red and green, but probably also brown and violet. Similarly, they can probably distinguish between red and skyblue, or red and lightgreen because they are different saturdations of color.


    Personally if I had a color blind CIO, I would create a color spec using the following colors on each chart:

    All of this list: black, gray, lightgray, darkgray, white

    one from this list: blue, red, green, violet, brown, purple, teal

    one from this list: yellow, skyblue, lightgreen, lightblue,pink,orange

    one from this list: crimson, darkblue,darkgreen


    I'd then have them look at the chart, and tell me which ones are hard to distinguish.


    If you haven't written a colorspec before, here is an example that uses the above trick, for a chart with 'Cost' and 'Budget' displayed in it's legend:

    Cost=red;Budget=lightGreen


    Hope this helps. If you discovered particular colors that work well for your colorblind user please share.


    #CostingStandard(CT-Foundation)


  • 5.  Re: Charting Question - Color Blindness

    Posted Wed April 01, 2015 05:52 PM

    Thanks for the detailed answer Stephen!


    #CostingStandard(CT-Foundation)


  • 6.  Re: Charting Question - Color Blindness

    Posted Fri April 03, 2015 08:53 PM

    Thank you for the detailed response! I will let you know what works, if we are provided feedback about the charts.


    Is the Apptio ideas section part of Community? How do I submit an idea?


    #CostingStandard(CT-Foundation)


  • 7.  Re: Charting Question - Color Blindness

    Posted Thu April 09, 2015 08:02 PM

    Hi Deb,

    Apologies for the late response. Yes, the Ideas is a Subspace within the Community. You can reach to it by clicking on the Product Central and then selecting the appropriate product. Once you have selected Cost Transparency Applications, click on the "Subspaces" (circled below) tab and you will see the "Cost Transparency Applications Ideas" as one of the Spaces.


    Untitled.png

    Click on the NEW IDEA link (circled below) to create a new idea.

    Untitled.png

    Hope this helps.

    ~Shobha Bahuguna


    #CostingStandard(CT-Foundation)


  • 8.  Re: Charting Question - Color Blindness

    Posted Fri April 10, 2015 11:17 AM

    At this time, what Shobha has demonstrated is the only current way to get to the Ideas space.

    We are actively working on making this space easier to access from the Cost Transparency Applications space.


    Sorry for the work-around. We should have something up soon.


    -Brandon


    #CostingStandard(CT-Foundation)


  • 9.  Re: Charting Question - Color Blindness

    Posted Thu April 02, 2015 08:29 PM

    Agree that this should be added to the Apptio ideas section, since it'd be nice to specify the marker shapes within the report studio.


    For the time being, here's a trick that may be potentially useful:


    Apptio is delivered as a SAAS application, which means that to view it you have to use a web browser. Most major web browsers (IE, Firefox, Chrome) have a tab for web developers to use, which contains a scripting console which allows the user to modify the page using Javascript. In this example I'll use Firefox as the browser, but the content should hold constant for other browsers as well.


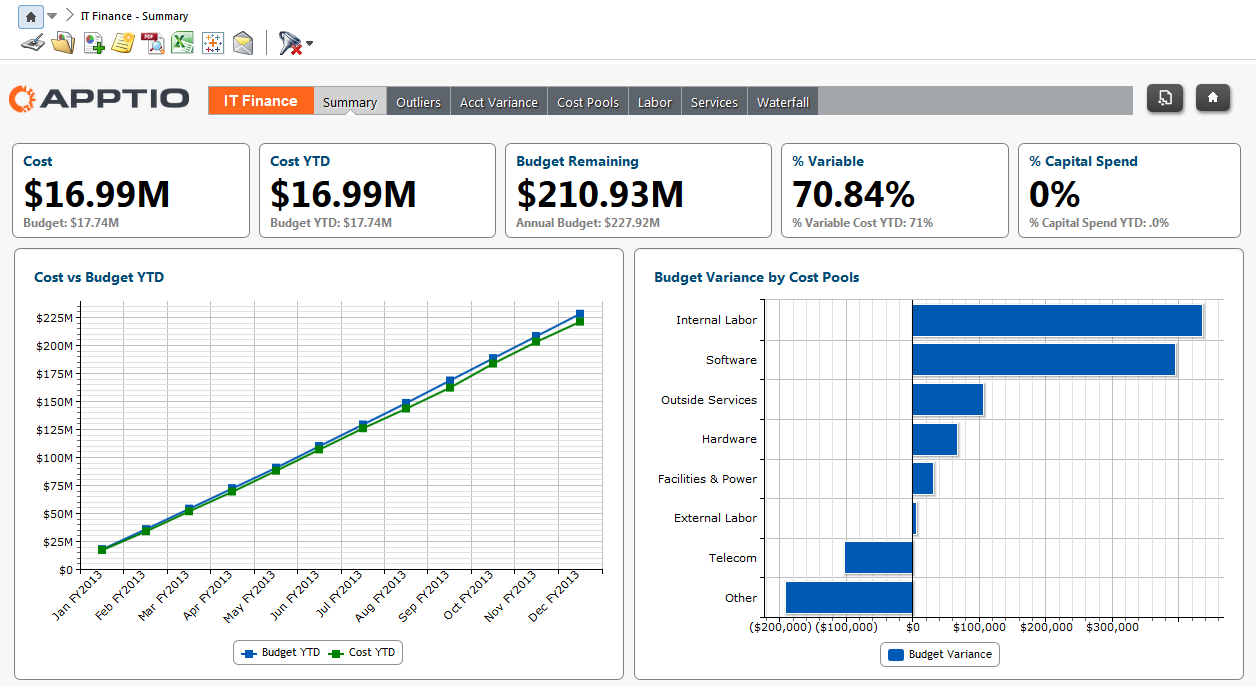
    1) Navigate to the page which contains the graph you would like to modify.


    2015-04-01 16_36_25-Apptio - (mverkruyse.apptio.com) Reference CTF - Models.png


    2) Match the color of the graph that you are trying to modify--some tips to do that are here:


    [+] STUMPER: Exact color match in report


    Also, the default Blue/Green used in Apptio out of the box reports (and seen in the example) are:


    Blue: #0059b3

    Green: #008000


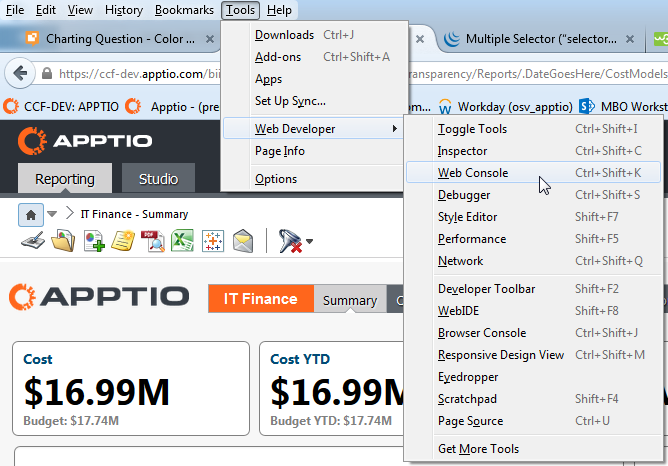
    3) Open up the web console (In Firefox it's listed under Tools -> Web Developer -> Web Console, you can also press "CTRL + SHIFT + K")


    2015-04-02 17_12_35-.png


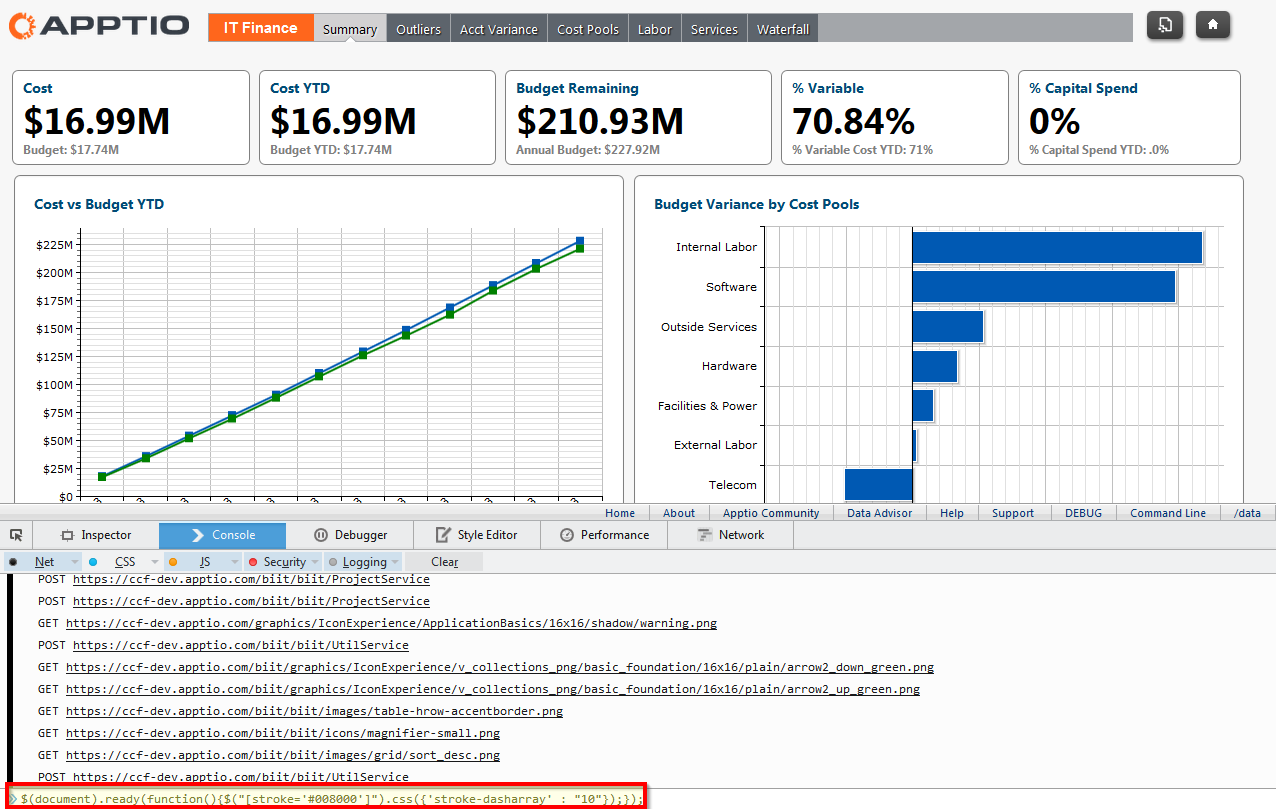
    4) Paste the following JQuery scripts to modify the graph, then hit "ENTER":


    $(document).ready(function(){$("[stroke='#008000']").css({'stroke-dasharray' : "10"});});


    The text highlighted in red are the pieces that will change the line, the first is the hexadecimal value to find the line to change, and the second is the thickness of the new dashed line.


    $(document).ready(function(){$("path[fill='#0059b3']").css({'fill' : '#000000', 'stroke-width': '3', 'stroke': '#0059b3'});});


    The text highlighted in red are the pieces that will change the markers, the first is the hex value to find the markers to change, the second is the new color of the marker (if you want it to remain the same, keep it as the first hex value), the second is the size of the new border, and the last is the color of the new border).

    2015-04-02 17_26_49-Apptio - (ccf.org) Cost Transparency - Service Costing _ IT Finance - Summary.png


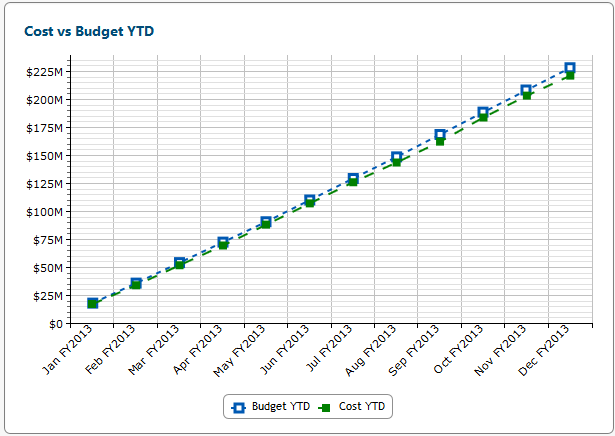
    5) Not a perfect solution, but now there is some definitive differences in line visibility that should be more accommodating to the color-blind. Note that these changes will not be saved once the page is left.

    2015-04-03 06_28_55-Apptio - (ccf.org) Cost Transparency - Service Costing _ IT Finance - Summary.png


    Hope that helps at least in part!


    -Michael Verkruyse


    #CostingStandard(CT-Foundation)