Hello, @Prakash Yanamandra.
You get the properties when you right-click on the headings of a table in a report:

Then you can select Properties.
If you refer to changing the colors, as an entry in this thread describes (Wed August 14, 2019 11:33 AM), you need to select the chart you want and ensure you are in the Overlay chart.
------------------------------
Regards, Guillermo
------------------------------
Original Message:
Sent: Wed March 26, 2025 05:43 PM
From: Prakash Yanamandra
Subject: Re: Can you change the color of a graph in an overlay chart i.e. second layer not shown as blue like the base layer
Hi, I am new to creating reports in APPTIO. i am looking for this option. i do not get any pop-up when i right click on a report. do I need a specific role to get the report properties ?
Please advise.
------------------------------
Prakash Yanamandra
Original Message:
Sent: Wed August 14, 2019 11:32 AM
From: Apptio Community Member
Subject: Re: Can you change the color of a graph in an overlay chart i.e. second layer not shown as blue like the base layer
Hi,
You should be able to change the colors of any of the metrics on a report using the properties:
1. Right Click on the chart you want to alter and choose properties.
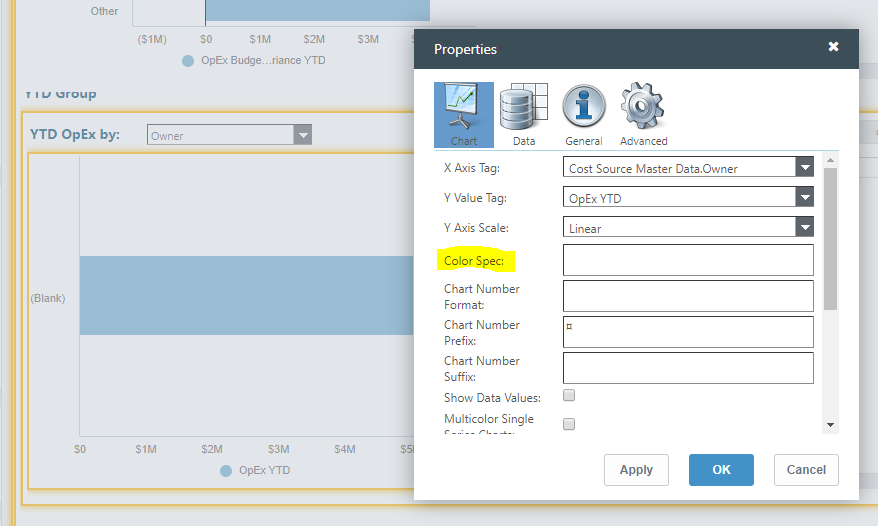
2. The first tab (Chart) you will see a Color Spec option.
3. Type out the name of the metric and then you can use Hex code or lowercase of a colors name to change the color.
4. In the example below I changed it from the OOTB blue to green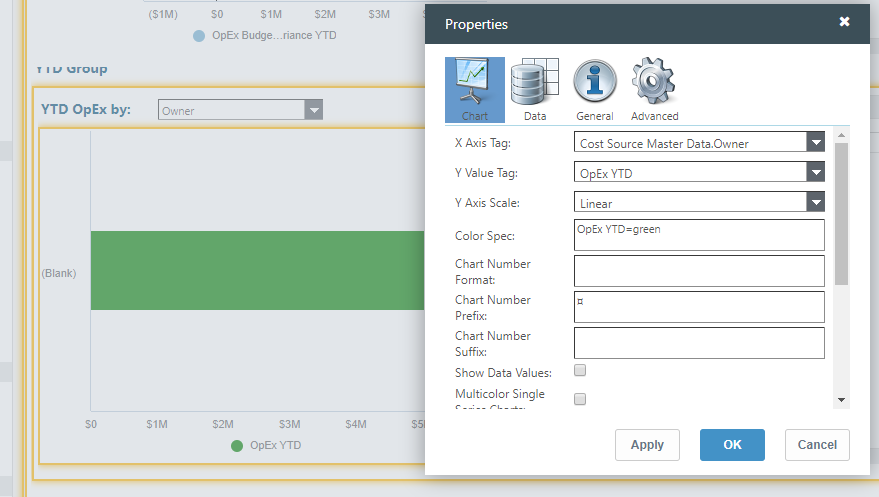
Let me know if you need any clarification,
Lauren Griessel
#CostingStandard(CT-Foundation)