Hello,
I am working on T&E reporting for senior leadership and had a question on formatting graphs.
The graph is supposed to show what percentage of travelers booked utilizing our travel agency for the last year by quarters and one year ago from the current month. See example of what the graph should look like below (Note: graph was built in Excel).
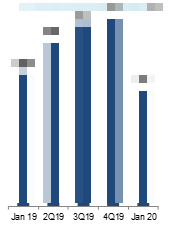
Does anyone know how to set up this view in Apptio as a graph?
I currently have 2Q19-4Q19 and Jan 20 however am having some trouble also bringing in Jan 19.
Thanks!