This post is part of a series:
Concept
Use a histogram to graphically summarize the frequency distribution of a single variable within a data set.
Good for quickly displaying:
- Center of the data (if any)
- Spread of the data
- Skewness (lopsided or not)
- Outliers
Examples
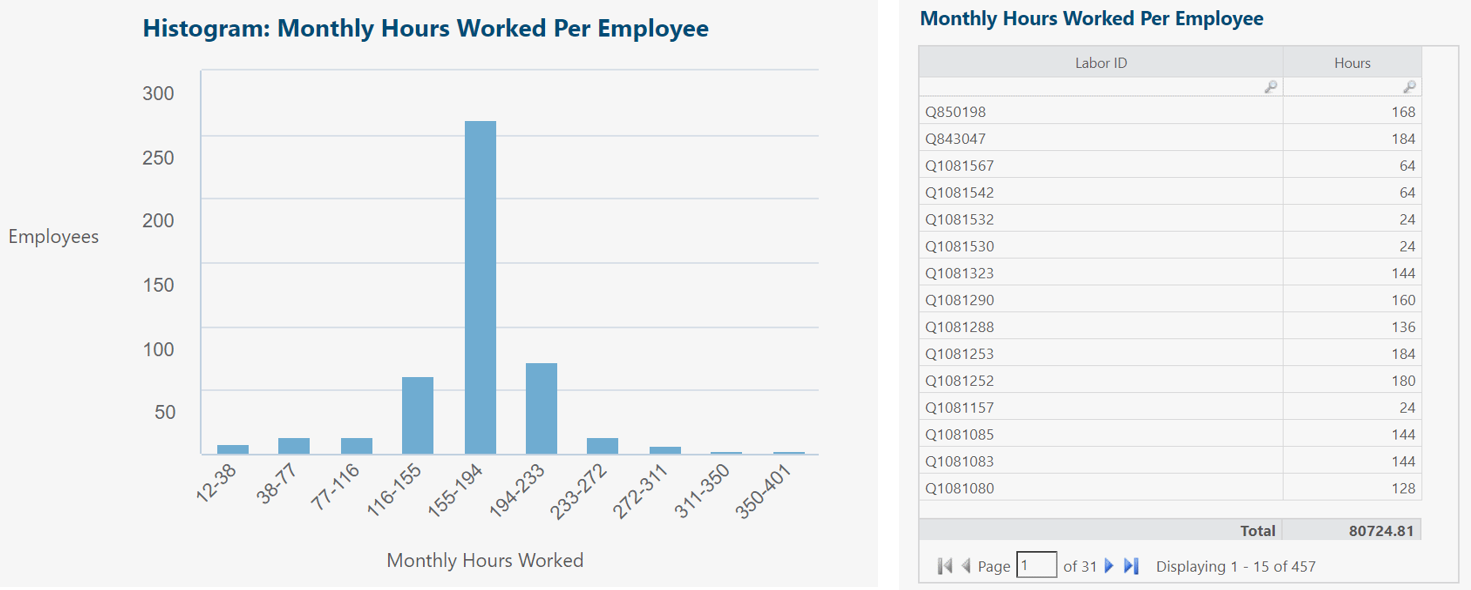
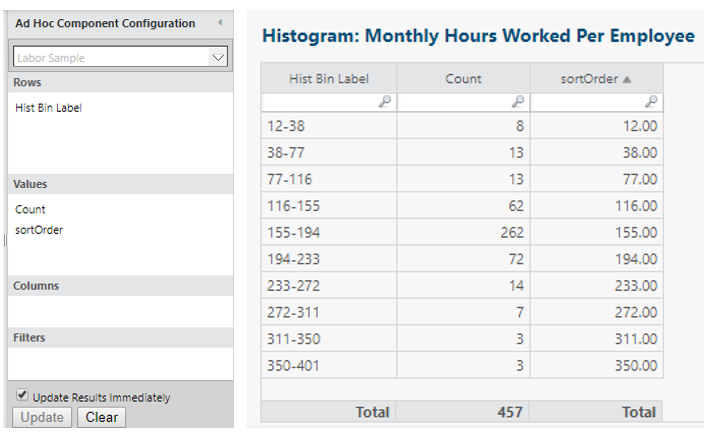
Insights and questions from above histogram:
- Bell-shaped (normally distributed) curve, centered on 155-194 hr/mo range.
- Matches expectations: Most employees working 155-194 hr/mo (40 hr/wk = 160 hr/mo).
- Relatively few employees working <116 or >233 hr/mo.
- Probably should look into outliers (12-77 hr/mo and 311-401 hr/mo).
- Useful to re-run analysis, categorized by employee type or location.
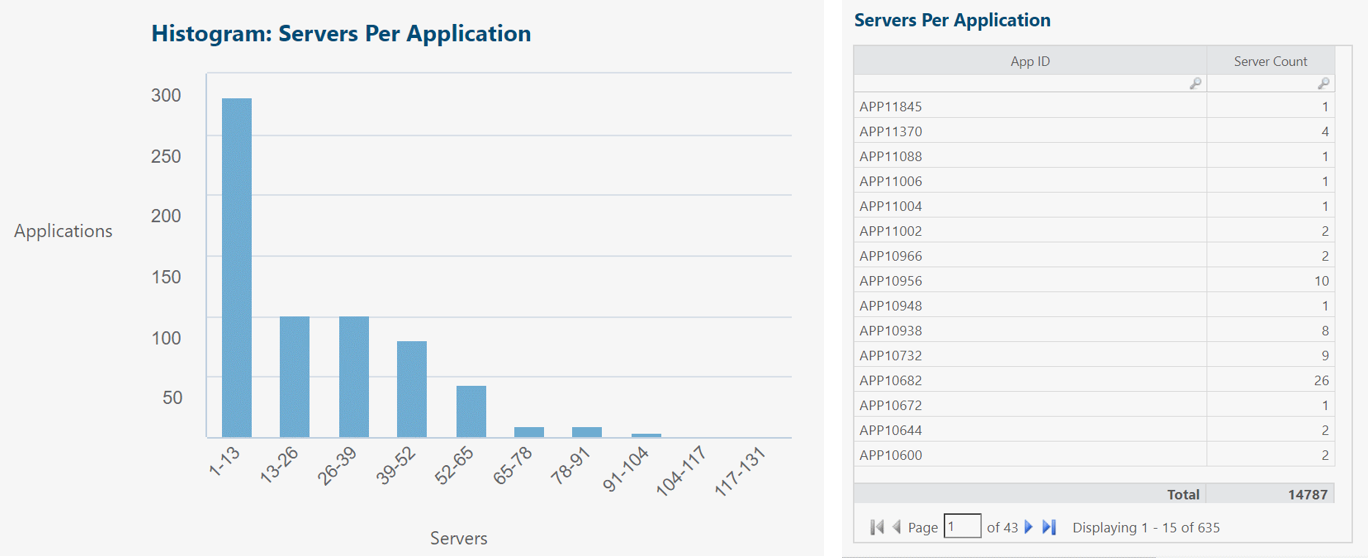
Insights and questions from above histogram:
- Not bell-shaped curve. Leans left toward 1-13 servers-per-app range.
- Most applications supported by 1-13 servers.
- Consider re-running analysis with more x-axis bins or just in the 1-13 range for a closer look.
- Probably should look into outliers (78-131 servers per app).
- Useful to re-run analysis, categorized by server type (virtual/physical) or app function.
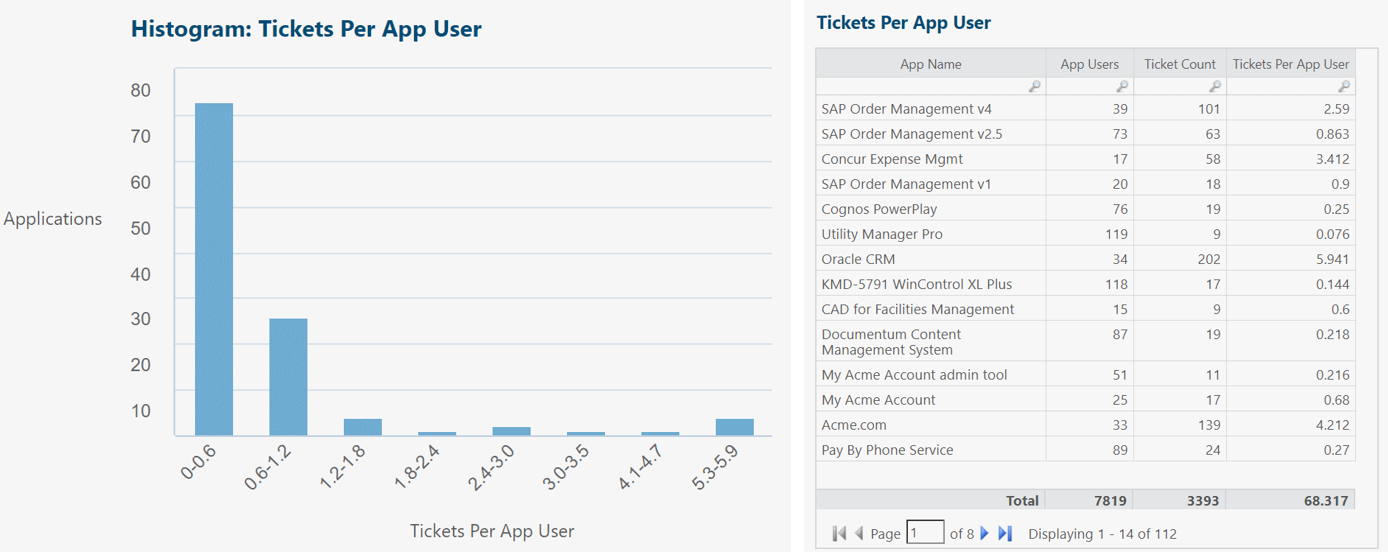
Insights and questions from above histogram:
- Assume fewer tickets per app is desired (i.e., tickets not generated as part of regularly recurring process).
- Not bell-shaped curve. Actually sort of an inverted bell curve, with a rise toward the right.
- Most apps generating 0 to 0.6 tickets per app user, although many in 0.6 to 1.2 range.
- Probably should look into outliers (5.3 to 5.9 range). Need additional end user training? Research alternative apps with similar function?
Histograms in R12
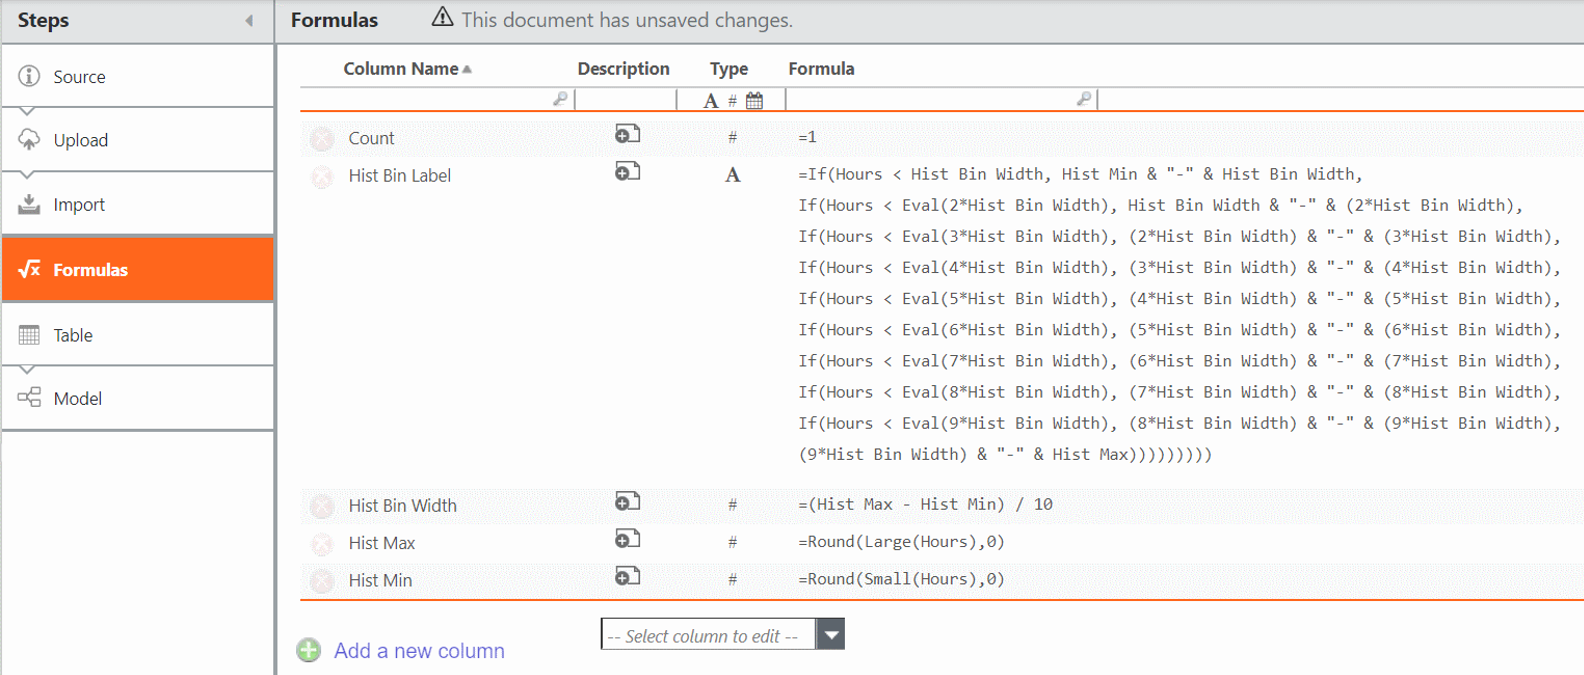
Add the columns above to Formulas transform pipeline step in data table.
For example, if Hours is variable of interest and we want 10 x-axis bins:
Count = 1
Hist Min = Round(Small(Hours),0)
Hist Max = Round(Large(Hours),0)
Hist Bin Width = (Hist Max - Hist Min) / 10
Hist Bin Label = If(Hours < Hist Bin Width, Trunc(Hist Min) & "-" & Trunc(Hist Bin Width),
If(Hours < Eval(2*Hist Bin Width), Trunc(Hist Bin Width) & "-" & Trunc(2*Hist Bin Width),
If(Hours < Eval(3*Hist Bin Width), Trunc(2*Hist Bin Width) & "-" & Trunc(3*Hist Bin Width),
If(Hours < Eval(4*Hist Bin Width), Trunc(3*Hist Bin Width) & "-" & Trunc(4*Hist Bin Width),
If(Hours < Eval(5*Hist Bin Width), Trunc(4*Hist Bin Width) & "-" & Trunc(5*Hist Bin Width),
If(Hours < Eval(6*Hist Bin Width), Trunc(5*Hist Bin Width) & "-" & Trunc(6*Hist Bin Width),
If(Hours < Eval(7*Hist Bin Width), Trunc(6*Hist Bin Width) & "-" & Trunc(7*Hist Bin Width),
If(Hours < Eval(8*Hist Bin Width), Trunc(7*Hist Bin Width) & "-" & Trunc(8*Hist Bin Width),
If(Hours < Eval(9*Hist Bin Width), Trunc(8*Hist Bin Width) & "-" & Trunc(9*Hist Bin Width),
Trunc(9*Hist Bin Width) & "-" & Trunc(Hist Max))))))))))
Create report table similar to above screenshot:
Rows: Hist Bin Label
Values: Count
Values: (new numeric-type column) sortOrder = Split(Labor Sample.Hist Bin Label,1,"-")
Sort ascending by sortOrder column.
Hide sortOrder column.
(top Ribbon) > Ad hoc > Column.
Drag Hist Bin Label from Rows to Columns in configuration panel.
Optional: Add text labels (HTML component) to X and Y axes.