 Co-author: Eric Erpenbach, Program Director
There are many different AIOps products to choose from with various capabilities to bring insights into the activities of IT environments. The goal for these products is to simplify the management and, more importantly, resolve issues when they occur or even recognize when an error is going to occur. As part of this, some products focus on applying AI to the information from the IT environment, while others focus on how to communicate the information and provide options to resolve issues. While comparing the different capabilities is a key determinant in selecting the best product, it is also important to look at the capacity that can be supported by the capabilities. It is the capacity that might be the deciding factor in the selection of product that will meet the needs of your IT environment.
Before discussing the capacity, let’s begin with a brief introduction to Watson AIOps.
IBM Cloud Pak for Watson AIOps 3.1 (for convenience, referred to as “Watson AIOps” for the rest of this blog) offers a set of capabilities to predict, communicate and resolve events before they develop into serious problems. By collecting information from multiple data sources like logs, metrics, and events, as well as topology and application information, it helps CIOs and SREs by uncovering hidden insights. Those insights may allow for proactive steps to be taken to prevent a failure or allow for issues to be resolved with little intervention. These insights can also be directly delivered in near real time into team collaboration tools like Slack or Microsoft Teams.
In short, Watson AIOps provides you with an unprecedented visibility into your organization’s infrastructure and applications, predicting failures and facilitating problem resolution.
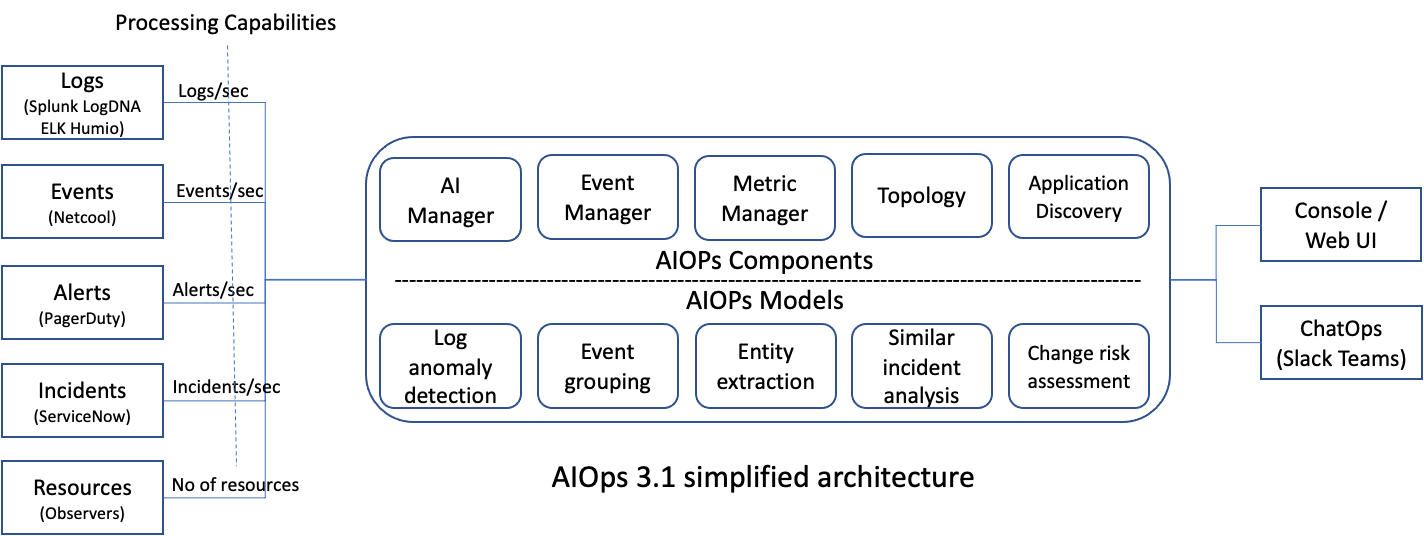
The core functions of Watson AIOps can be categorized into a set of capabilities: event management, incident diagnosis, incident resolution, and insight delivery. Its five major components are AI Manager, Event Manager, Metric Manager, Topology and Application Discovery. You can train the data with built-in AI models for log anomaly detection, event grouping, entity extraction, similar incident analysis and change risk assessment. Here is a simplified architecture diagram that illustrates various Watson AIOps data sources and associated capabilities:
Sizing
Watson AIOps can be deployed with a small or large sizing profile. The small profile is suitable for development, test, and proof-of-concept (POC). The large profile is suitable for a production environment. It is important to understand the processing capabilities offered by each of these profiles because the choice of sizing profiles directly affects the deployment cost in terms of hardware capacity and licensing.
Capability Metrics
What sort of capability metrics does Watson AIOps offer? Even though it’s not an exhaustive list, the table below captures the types of data sources and the associated capability metric defined in terms of data throughput rate:
|
Data Source
|
Capability Metric
|
AIOps Component
|
|
Events
|
Events per second
|
Event Manager, Topology
|
|
Alerts
|
Alerts per second
|
Event Manager
|
|
Incidents
|
Incidents per second
|
Event Manager
|
|
Logs
|
Logs per second
|
AI Manager
|
|
Resources
|
Number of resources
|
Topology
|
|
KPI (Key Performance Indicator)
|
Number of KPIs
|
Metric Manager
|
These capability metrics can be broken down even more. For example, here is the event throughput rate per second for the Watson AIOps 3.1 event manager component:
|
Event nature
|
Event throughput rate
|
|
|
Small profile
|
Large profile
|
|
Steady state
|
20
|
50
|
|
Burst rate
|
100
|
500
|
When choosing a sizing profile, you should consider the expected average event flow rate or steady state, and the peak event flow rate or burst rate, that can occur occasionally from all the event data sources.
In addition, the average size of an event is important when computing the required data throughput rate. For instance, the size of an event from a Netcool system can vary from 4K to 16K bytes. If a data source produces large-sized events most of the time, then the required data throughput rate needs to be adjusted accordingly.
If some deployment solutions have a specific data handling rate that must be met, then you should map the data handling rate to the offered data throughput rate, taking into consideration the average data type size. For example, let’s turn to the estimation of the data handling rate from a data source. To do this, gather the logs generated by your data source in a 24-hour period, and count the number of records in all the log files. Divide the total number of records by 24 x 60 x 60 (i.e., 86,400) to get the average number of logs per second. This will then give you the data handling rate that you can map to the throughput rate.
For log data sources like LogDNA, they can limit the number of log records that can be returned per request based on the offering plan. In such cases, the log per second processing rate should be able to support the number of logs retrieved through the log retrieval operation.
On resources, the Watson AIOps Topology component supports a maximum number of resources for analysis and visualization, based on the deployment profile.
|
Resources
|
|
Small profile
|
Large profile
|
|
200,000
|
1,000,000
|
A stand-alone Metric Manager deployment supports a maximum number of key performance indicators (KPIs) for processing, based on the deployment size.
|
KPIs
|
|
Small profile
|
Large profile
|
|
100,000
|
500,000
|
For components like the above, the data handling rate can be estimated by resources, or by KPIs generated by each of the monitoring or managing entities.
In summary, you should adopt the appropriate techniques to estimate the overall data throughput rate that is required based on the data sources, and choose a deployment profile that best supports the data handling capacity requirements.
Further information
To explore the topics raised in this blog in more detail, refer to the official product documentation:
#eventmanager#metricmanager#CloudPakforWatsonAIOps#cp4waiops#AIOps