Authors: Ricardo Olivieri, Isabell Sippli, Matthew Duggan
Introduction
In this second part of our two-part article, we continue describing the must-know fundamentals for getting the most out of Cloud Pak for AIOps. We start this second part by exploring the topic of topology and inventory information and the value that such data provide in CP4AIOps. Also, the capabilities in CP4AIOps’ AI engine for anomaly detection, alert correlation, risk assessment of change requests, and identification of similar tickets are described. If you have not read Part 1 of this two-part article, we recommend doing so before going over the content below.
What is CP4AIOps? (cont.)
A flexible topology and inventory manager for end-to-end visibility of infrastructure, applications and services
In anything other than a trivially simple environment, operations staff rapidly run into the need for good understanding of the composition of their infrastructure, applications and services; and for context around increasingly opaque alerts, metrics, and logs. Topology and inventory data is the key to giving operations teams the data needed to make decisions on what’s affected and what’s not, what to work on next, risk, and whether applications and services are impacted by problems or not.
Modern infrastructures are highly complex insofar as they often have the need to manage physical IT, network, and storage assets but with the additional complexity and volatility of intent-based orchestration, virtualisation, and hybrid infrastructure and service use via cloud platforms such as Microsoft Azure or IBM Cloud. Large environments will comprise tens of millions of individual and distributed resources, such as servers, disks, network ports, and containers or VM’s - any of which could have an alert that needs managing.
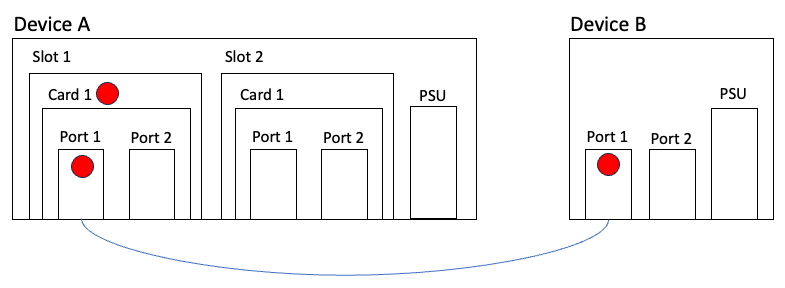
To illustrate the value that good topology data provides, consider the following example where Device A has critical alarms on Slot 1/Card 1 and Slot 1/Card 1/Port 1, while Device B has a critical alarm on Port 1. From this topology data we can conclude:
-
Device A/Slot 1/Card 1 is the likely cause of the problem as its child resource, Port 1, also has a critical alarm and that’s connected to Device B/Port 1.
-
Device A is a larger and potentially more important device than Device B and it has some spare capacity, which helps with maintenance window planning as the Device B connection could be moved to Device A/Slot 2/Card 1/Port 1. A simple cable swap is often far simpler than a card swap and can often be done by data centre staff without specialist skills.
-
Both have power supply units (PSU), which provides an opportunity for environment monitoring of the devices (think of temperature and voltage values).
-
Both Device A and Device B do not have redundant power supplies which presents a risk. Similarly, if Device B were a server, it’s not redundantly connected to anything other than Device A and, consequently, there’s a single point of failure risk.
-
Assuming that properties are known for the devices, cards, and ports; this information can be used to help in a number of scenarios other than incident management, such as whether firmware needs updating, audit tracking of hardware via serial numbers, and opportunities for configuration improvements. We may also know who the contact is, the device type, model and version, where it’s located, which services it’s running and numerous other pieces of information that’s simply not available in alerts, metrics, and logs. Topology/inventory, therefore, is a great source of data for enrichment.
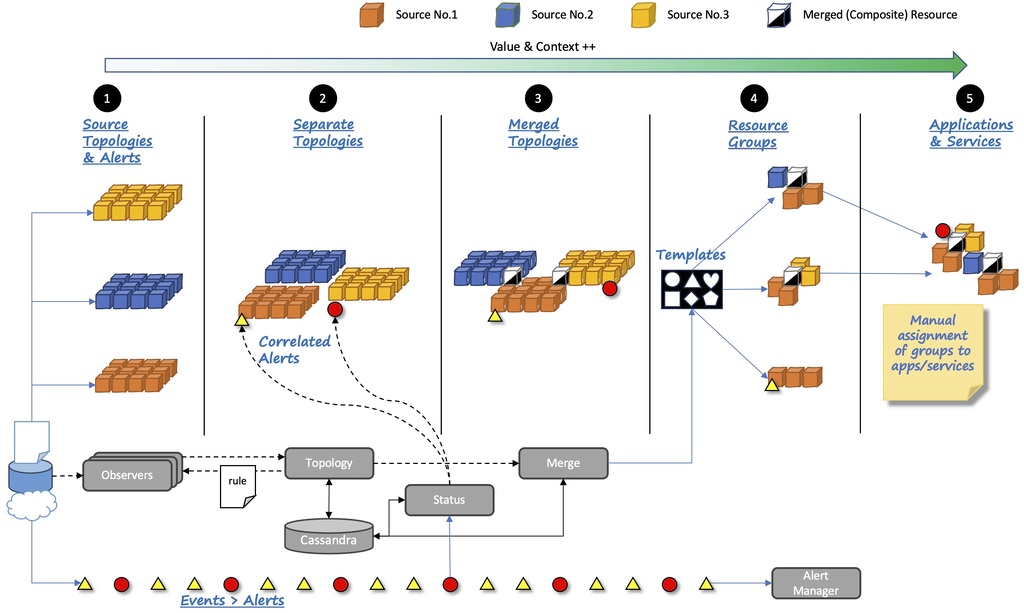
It is the job of CP4AIOps topology manager to build and maintain a model of those resources, how they’re related and how they support applications and services that are important to the business. Topology manager provides the following high level functions (a summary of the data flow is shown in the next diagram below):
-
Collection of topology/inventory and state data from a myriad of sources in parallel and with the goal of collecting (or listening) at a rate that reflects the source’s rate of change so as to keep the model up to date. Topology manager provides highly flexible modelling and integration capabilities that permit the user to model ‘anything’ that matters to the business.
-
Automatic tracking of how the infrastructure and applications/services have changed over time so that operations teams can view historical perspectives on the data.
-
Automated construction of a rich and end-to-end model across data sources. For example, a goal is to understand which network infrastructure supports the servers hosting a given application. Users can also use their own data to enrich those from out of the box integrations and/or to provide net-new data, such as application composition not known to any other source.
-
Correlation of alerts to topology resources so that operations teams can understand the state of resources in the topology and how those resources are related. This is a key point - consider a network switch failure that renders a set of servers unreachable - the right topology data not only helps identify cause and impact but also which teams need to resolve the issue.
-
Automated grouping of resources into groups that matter to the business. For instance, applications are ultimately considered a group of resources by CP4AIOps but ‘anything’ can be grouped to meet business needs, and so the user can model teams, geographical locations, resources by type, etc.
-
Award winning user interfaces that provide rapid access to summaries of application, group and resource status, Google-like searches and structured filtering, and rich topology visualisation capabilities including the ability to look at history, more effectively collaborate, share views, and dynamically alter the style of the topology based user specified criteria. Users can also define context-sensitive right-click tools for resources and relationships, including scope control.
-
A rich set of well documented API’s are available for numerous topology manager micro-services.
CP4AIOps’ topology manager provides operations teams with complete up-to-date visibility and control over dynamic infrastructure and services. It lets you query a specific resource, and then presents a configurable topology view of it within its ecosystem of relationships and states, both in real time and within a definable time window (for further details see Benefits of Agile Service Manager).
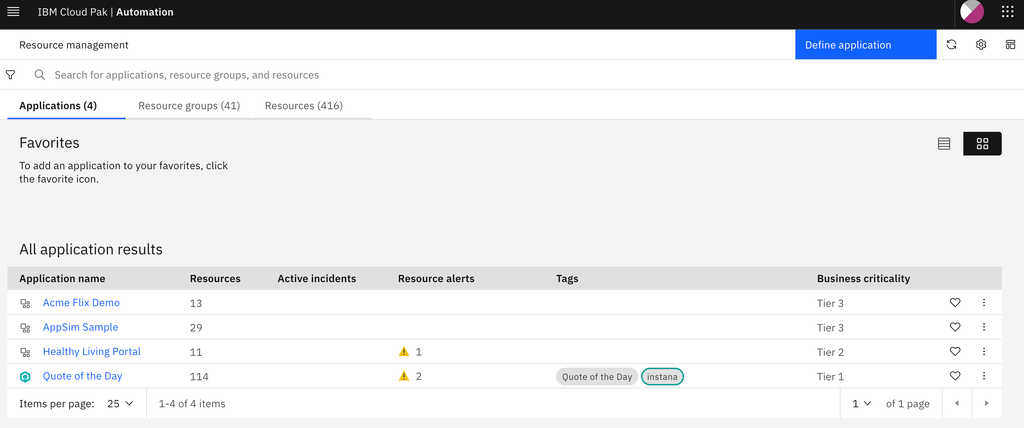
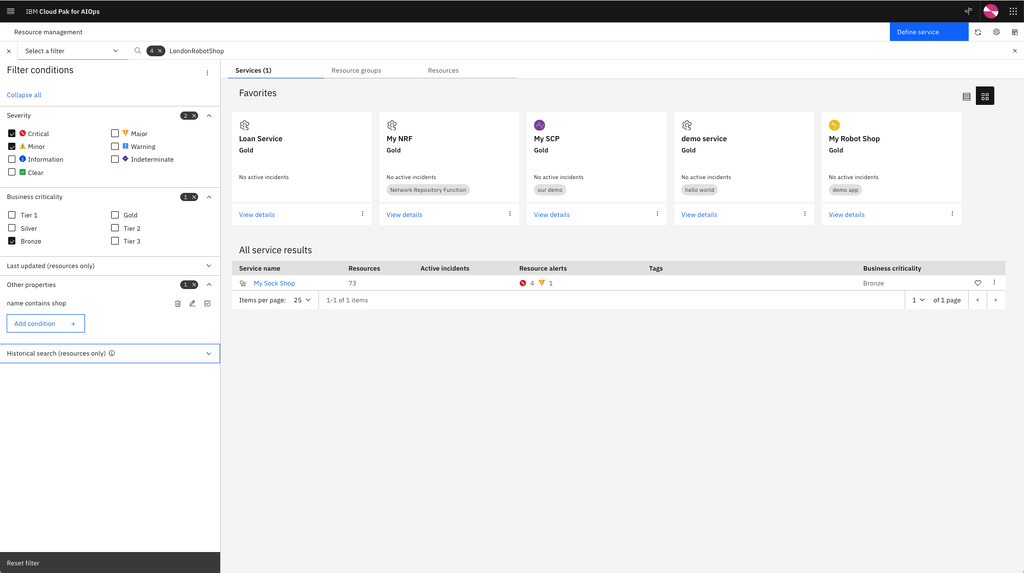
With the topology manager in CP4AIOps, you can also flexibly group individual services into higher level entities - like applications listed in the screenshot below.
The constituents (i.e., the corresponding resources) of the application are gathered automatically from a wide range of supported sources (for a full list, see Defining observer jobs for application and topology data). The types and attributes of the resources are flexible, and can be reconciled across tools. Therefore, you can use our topology engine to combine data from different sources. Imagine a micro-service hosted on a Kubernetes cluster that is monitored by an Application Performance Monitoring (APM) tool, and deployed by a continuous integration and continuous delivery (CI/CD) tool. You could then combine those data sources into a single resource, and then not only see up to date monitoring information, but also when the last deploy was triggered - all through a single interface.
Resources, groups, and applications/services managed by CP4AIOps’ topology manager can have a policy-based or manually assigned business criticality value, such as ‘Gold’, ‘Silver’, or ‘Bronze’. This is to differentiate between resources, groups, and applications/services that would otherwise be indistinguishable from a prioritisation standpoint. The business criticality can be used for searching and filtering as well as by policies to tailor alert processing based on how important ‘something’ is to the business.
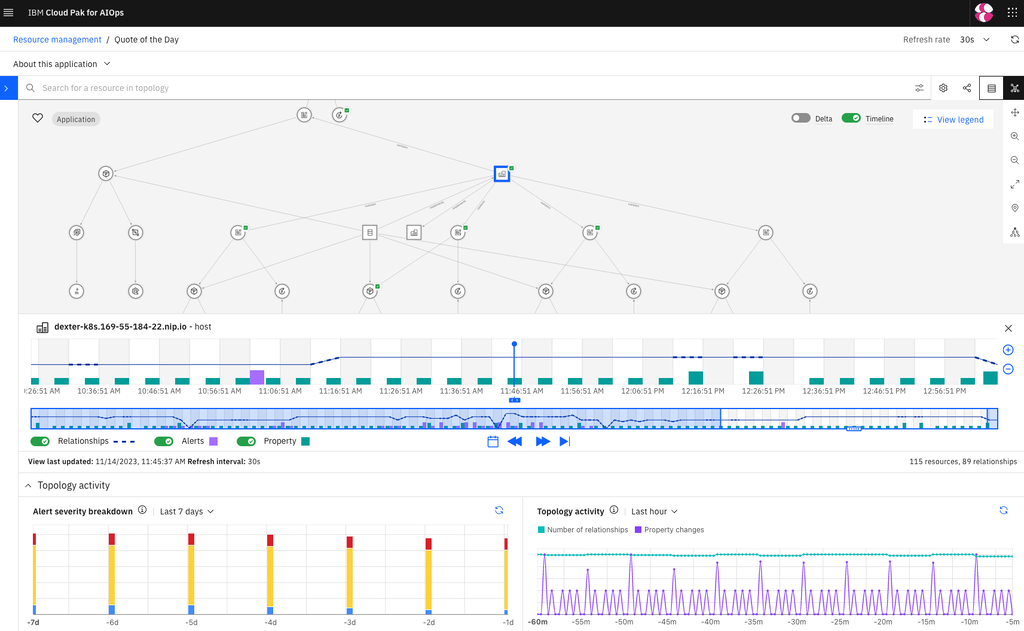
CP4AIOps topology manager provides a rich user interface to explore the managed environment.
The screenshot below shows:
-
An application (“Quote of the day”).
-
It’s constituents and how they are connected.
-
The timeline of changes for the selected resource (a host named “dexter-k8s.169-55-184-22.nip.io”).
-
How troublesome the application was over a selected time window (“Alert severity breakdown”).
-
The amount of changes the application saw over the last hour.
You can also browse the information in the topology database in a structured, inventory style. The screenshot below shows all resources that belong to an example business application:
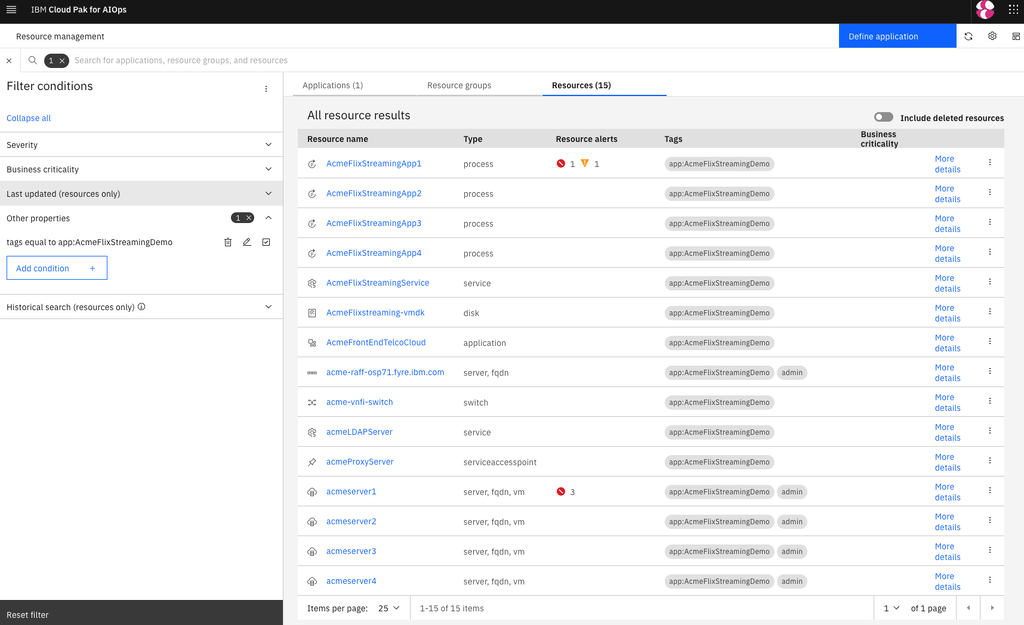
The grouping and application controls also allow you to roll up alerts into incidents, by leveraging the topological information to group the alerts (see topological grouping below).
Powerful filtering capabilities lets users easily find what they’re looking for and filters can be saved and rapidly recalled, and they can be assigned to individual users and/or user groups. This lets IT operations staff use CP4AIOps in a management-by-exception workflow as, for example, an operator can rapidly find all VMs that have a critical problem and that are tagged with, say, ‘My App’.
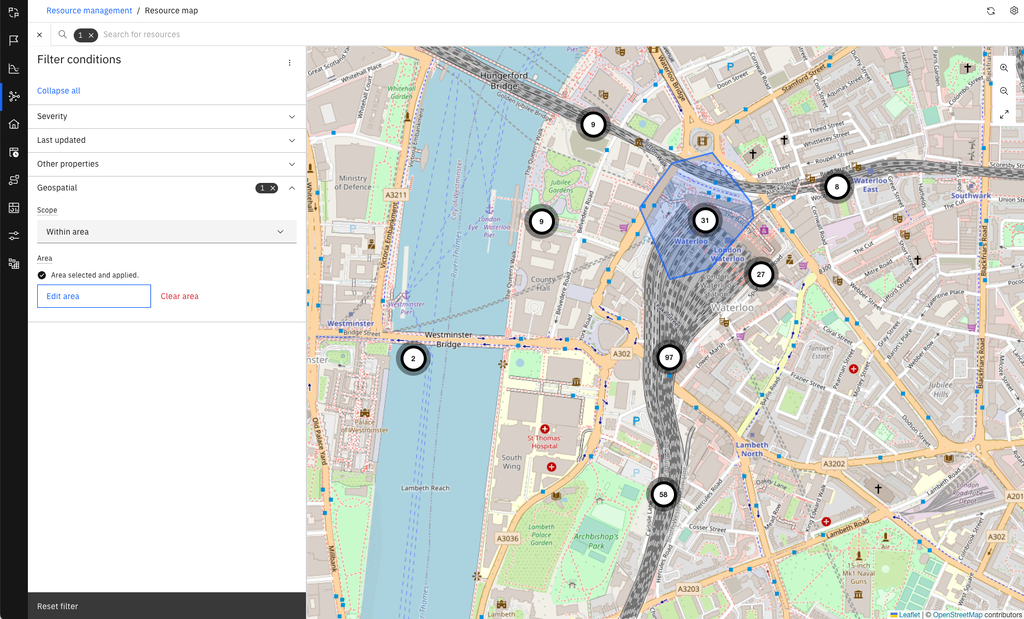
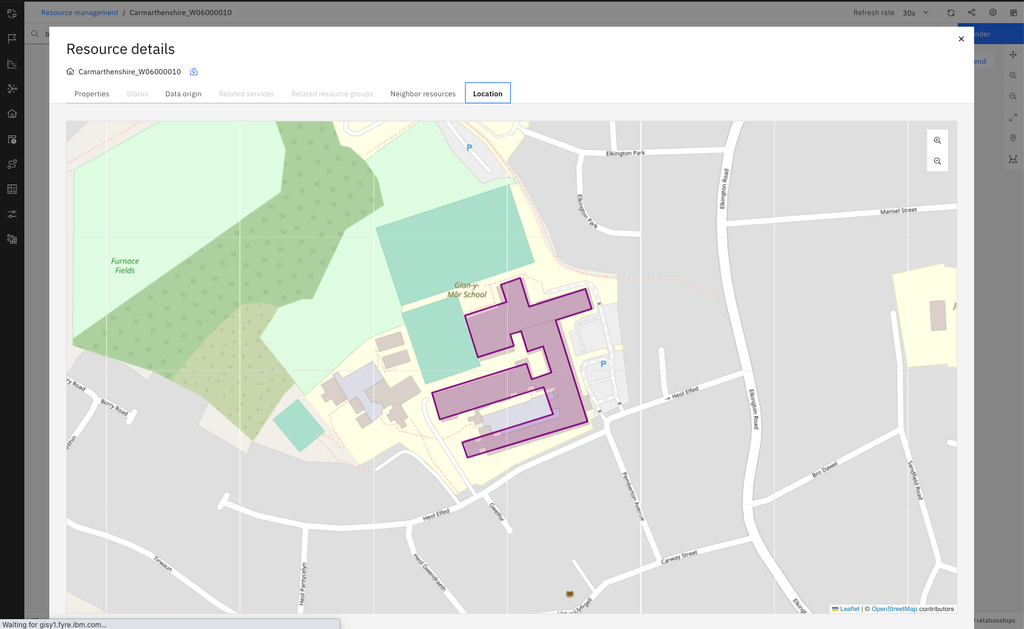
An exciting addition in the upcoming CP4AIOps release is the ability to model the geographical location of managed resources. Topology manager will let users manage latitude/longitude points, polygons, and linestrings - which lets CP4AIOps do model building of data centres, adverse weather events (e.g., floods), or even fibre optic cables. New search, filtering, and mapping capabilities will provide at-a-glance visualisation of resource locations and state.
An AI engine that reduces the need for manual rule driven approaches
CP4AIOps contains an AI engine that reduces the need for manual rule driven approaches to, for example, detect log and metric anomalies, event correlations and similar incidents. Let’s now look at some of these capabilities.
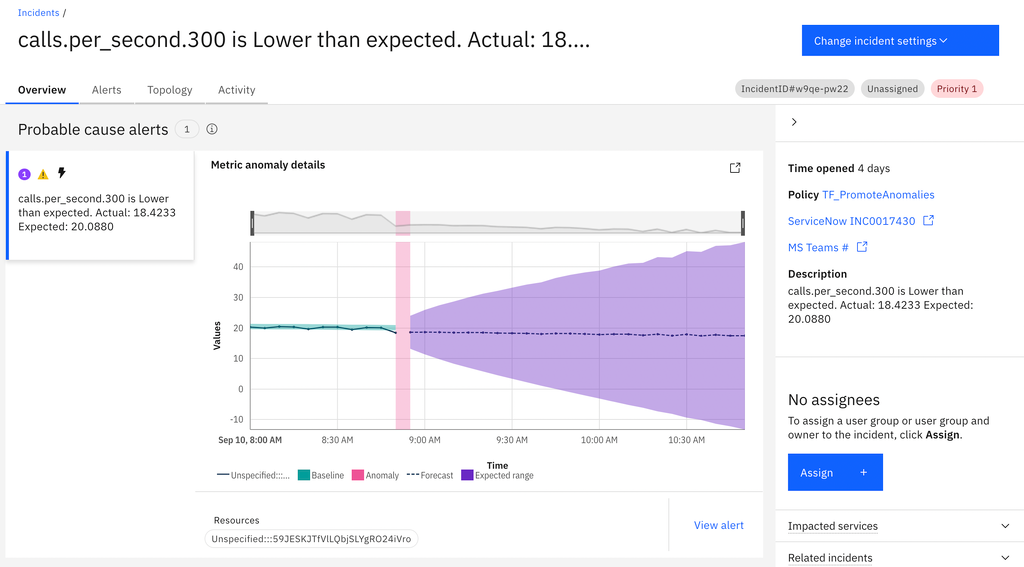
Metric anomaly detection
The metric anomaly algorithms in CP4AIOps raise a metric anomaly alert when:
-
A metric is detected to be outside its known normal range (i.e., baseline values).
-
A metric remains unexpectedly constant (flatlining).
-
A metric that is known to vary conspicuously, starts to vary significantly less.
-
A metric reaches value levels not reached previously (finite domain).
-
A metric is detected to exceed the range within which it normally varies (a new baseline is detected, which is completely different from the previously known one).
The metric anomaly algorithm in CP4AIOps is also used to forecast metric values based on historical data for the metric. Here’s an example of a metric anomaly:
Log anomaly detection
There are two log anomaly detection AI algorithms that are currently supported for production deployments, Natural Language Processing (NLP) and Statistical baseline.
NLP
The NLP unsupervised learning algorithm for log anomaly detection in CP4AIOps processes large amounts of log data to learn what is normal behavior for the components that make up, say, an application or an infrastructure deployment. This algorithm has the capability to determine when incoming log statements should be categorized as anomalies when compared to log patterns and their frequency typically exhibited.
Statistical baseline
The statistical baseline unsupervised learning algorithm for log anomaly detection in CP4AIOps only takes about 30 minutes to establish a baseline and to start providing value to IT operations teams. This algorithm supplements the NLP log anomaly detection algorithm by using a statistical moving average on the log data to discover abnormal behavior. This algorithm extracts entities (e.g., short text strings that indicate error codes and exceptions) from logs, which then combined with other statistics (e.g., number of logs for each component) are used to discover abnormal behavior. The extracted entities are used as clue words to understand other data in the log statements, such as numbers. For example, a 5XX number (e.g., 500, 501, 502, etc.) appearing in log messages might be a count or some other value, though if it is accompanied by clue words, such as HTTP status, then CP4AIOps infers that this number refers to an error code. When a significant statistical deviation in the occurrence of these is detected, CP4AIOps classifies it as an anomaly.
Ticketing data
Change Risk assessment
CP4AIOps uses an unsupervised learning algorithm to process historical change request records to compute the likelihood that a new change request would cause a problem, based on how successfully prior and similar change requests were deployed.
Similar tickets
CP4AIOps applies an unsupervised learning algorithm to historical incident records to aggregate related records and information and also extract the steps used to fix those problems (as long as those were properly documented). After training the algorithm, CP4AIOps identifies which previous incidents and fixes could be related to current problems, thus, speeding up the remediation of new issues.
Alert grouping/correlation
Alert correlation in CP4AIOps leverages grouping mechanisms which are described next. Grouping related alerts together within a single incident reduces noise and adds context for SRE engineers that otherwise would be quite difficult to gather on their own.
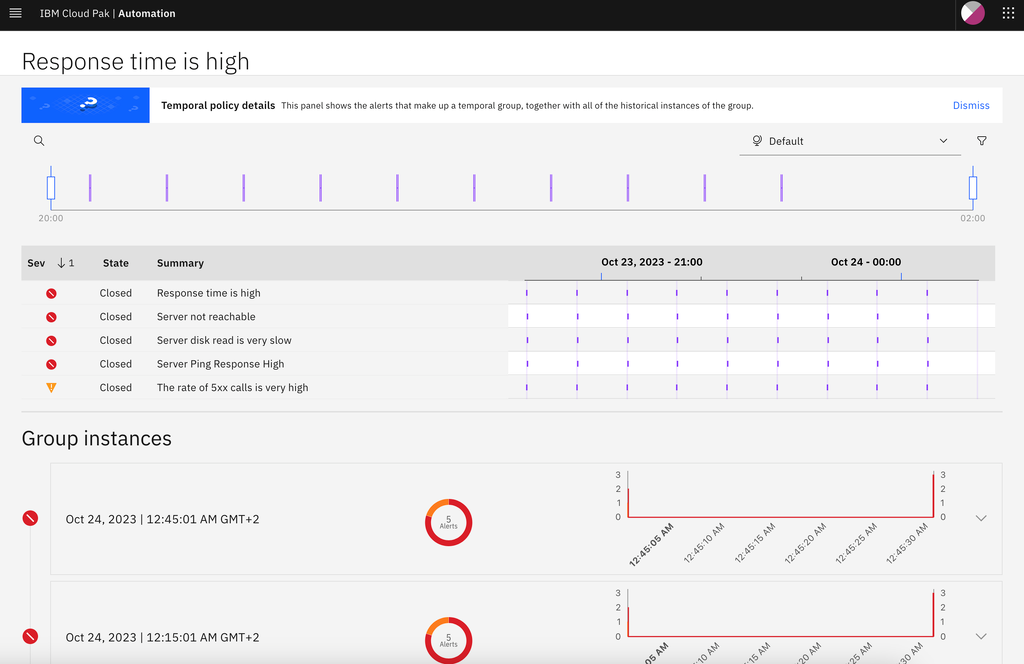
Temporal grouping
CP4AIOps uses an unsupervised learning algorithm to discover which alerts have co-occurred over time. Once this algorithm is trained with historical alert data, CP4AIOps will group current alerts that are known to co-occur, regardless where those alerts are originated from. Treating these co-occurring alerts as one problem reduces noise and adds context to the incident so IT teams can triage and resolve it more quickly:
Topological grouping
CP4IOPs uses an unsupervised learning algorithm for grouping alerts based on the topological resource groups from which those alerts originated. For example if you have a topological resource group comprised of the resources within a given OpenShift project, then any alerts originating from the resources in that project (such as pods) will be grouped together. This type of correlation provides valuable context to SREs to understand why related alerts might occur together based on their topological relationships.
Conclusion
As we conclude this two-part article, we hope that you've gained a deeper understanding of CP4AIOps and its capabilities as an incident management platform. By first providing a broad overview, followed by an in-depth exploration of CP4AIOps' AI engine, we aimed to give you a comprehensive perspective on this dynamic and relevant subject of AIOps and incident and problem management. In this second part, we highlighted the relevance and value that good topology/inventory data provides to operations teams. We also covered how leveraging alert correlation, anomaly detection, and ingestion of ticketing data in CP4AIOps as part of an organization’s incident management and collaboration process can increase the productivity and also decrease the possibility of IT & network outages and fatal problems. CP4AIOps uses AI/ML for processing and handling partial and imperfect data, given that there is no guarantee that the upstream observability and monitoring tools provide the same types and depth of data. We encourage you to continue exploring our IBM IT Automation portfolio of products. Finally, we look forward to working with customers in their AIOps adoption journey so they can get the most of the IBM IT Automation tools such as CP4AIOps!
#automation-featured-area-1
#automation-featured-area-2