By Ian Manning and Cormac Cummins
In the CloudPak for Watson AIOps team we have Performance engineers dedicated to helping us identify bottlenecks, sizing our services, and ensuring we scale linearly, so that we can support our largest customers. Recently, we encountered a memory issue, and I thought it would be beneficial to share our insight.
Aggregating Spark data
A couple of years ago, a colleague proposed using Spark Structured Streaming to help us aggregate data.
The advantage was clear. We use Spark a lot and the functionality was exactly what we needed: we could write a few lines of code to read data in, aggregate it, and write it back out ready for analysis!
Spark has the advantage of helping us distribute our analytic workloads across a cluster. This is ideal in cloud-based environments as we can scale out when required. It also means that customers do not need to have large servers – we can use many small servers that are more prevalent, especially in the Cloud, to distribute our analytics.
We encounter a problem
It was curious then that our Performance team informed us that our Application had run Out of Memory on a moderately-sized dataset. Spark was throttling the data for us - it wouldn’t read more until it has finished processing what it had already ingested.
The code was straight-forward and the data size was significantly smaller than the maximum amount of memory allocated. So something was seriously wrong!
Our investigation
Initial investigation of the Garbage Collection (GC) logs confirmed a java heap exhaustion. When you encounter memory issues with Java, there is only one thing for it – collect the heap dump or generate one and profile it!
The first thing that stood out was a lot of memory in a ConcurrentHashMap, which appears to be Spark Tasks. By default, the Spark UI keeps the last 100,000 tasks around which is useful for debugging. This is controlled by the parameter spark.ui.retainedTasks (https://spark.apache.org/docs/latest/configuration.html)
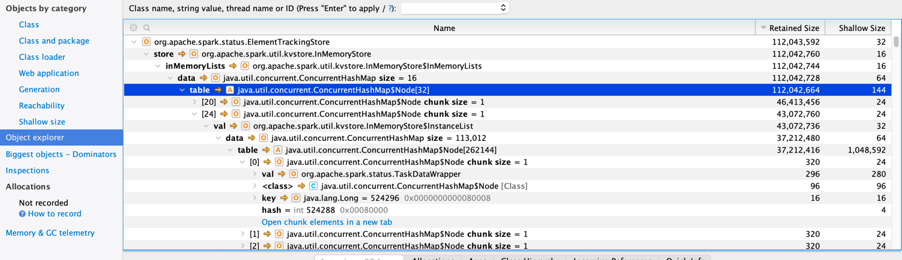
But it is also keeping the last 1000 executions! spark.sql.ui.retainedExecutions
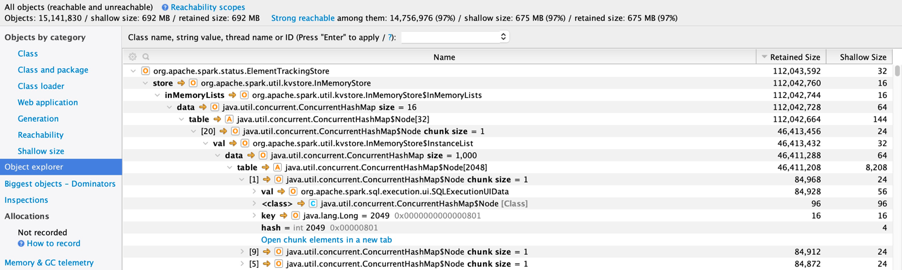
Together the objects use up a lot of memory that is not required on a production system. We can turn this off by setting spark.ui.enabled to false. Alternatively, we can set these values to be much smaller so that only a small subset is retained! We also have the flexibility to enable it if required for debugging purposes.
Spark Structured Streaming uses microbatches so there are a lot more tasks and executions when compared to our other Spark analytics. Therefore this issue hasn’t been something we previously encountered.
Looking for other oddities in the stack also revealed that we were caching a lot of data:
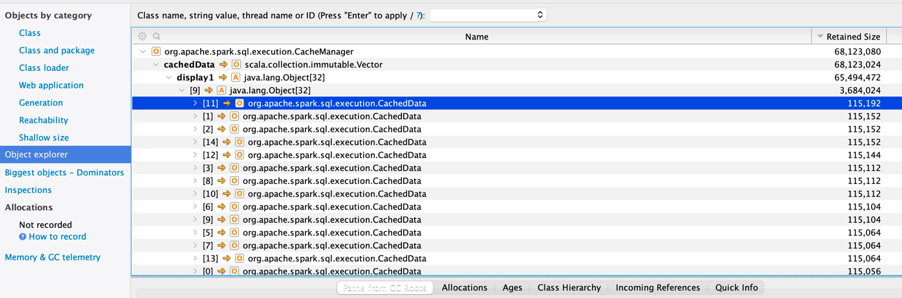
That may be normal. Caching can use a lot of memory, but that doesn’t mean it is a leak. What we need to do is ensure that we are caching in a reasonable fashion.
Data is pushed into the CacheManager with cache() or persist(), and we should ensure that we remove it as soon as it is no longer required with unpersist(). An analysis of the code showed a case when this was not happening, and for a long running Application like ours, this would lead to a perceived memory leak and potentially, an eventual OutOfMemory situation.
Next, we looked at JIRA to see if there was anything else memory-related we should know about:
Sometimes there are Resolved issues in a newer Spark version, or an open issue with your current version that can help shed light on problems, and workarounds that others have encountered. There is also a vibrant community to engage with for support.
The end of the investigation
Finally, we enabled verbose garbage collection logging again to ensure that the memory issues have truly been resolved and we no longer saw unexpected growth.
To enable verbose GC I added the following java parameters to my application:
-Xdisableexplicitgc -Xverbosegclog:/development/Application_gc_%Y%m%d.%H%M%S.%pid.log
I then ran performance tests and analysed the results with a tool called PMAT which is simple and light-weight.
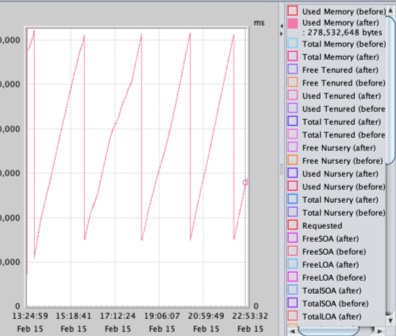
This graph shows the application going up to the maximum expected allocated memory, garbage collecting, and then coming back to a level that is consistent and not growing. This “sawtooth” pattern is exactly what we want to see. The Overall Garbage Collection Overhead - which indicates the percentage of CPU cycles spent carrying out Garbage Collection i.e. cleaning up memory was under a few percent indicating a well running and managed java heap.
Memory issues have been successfully addressed!
#howto#troubleshoot#memoryleak#CloudPakforWatsonAIOps#cp4aiops#AIOps#Spark