By Benedict Fernandes, Brian Safron
For years, the IT industry has used APM tools to monitor traditional monolithic applications. The self- contained nature of these applications made monitoring a straightforward, well-understood affair. If you knew the status of key metrics (e.g., CPU, memory, storage, garbage collection), you had a pretty good idea of the health of your application.
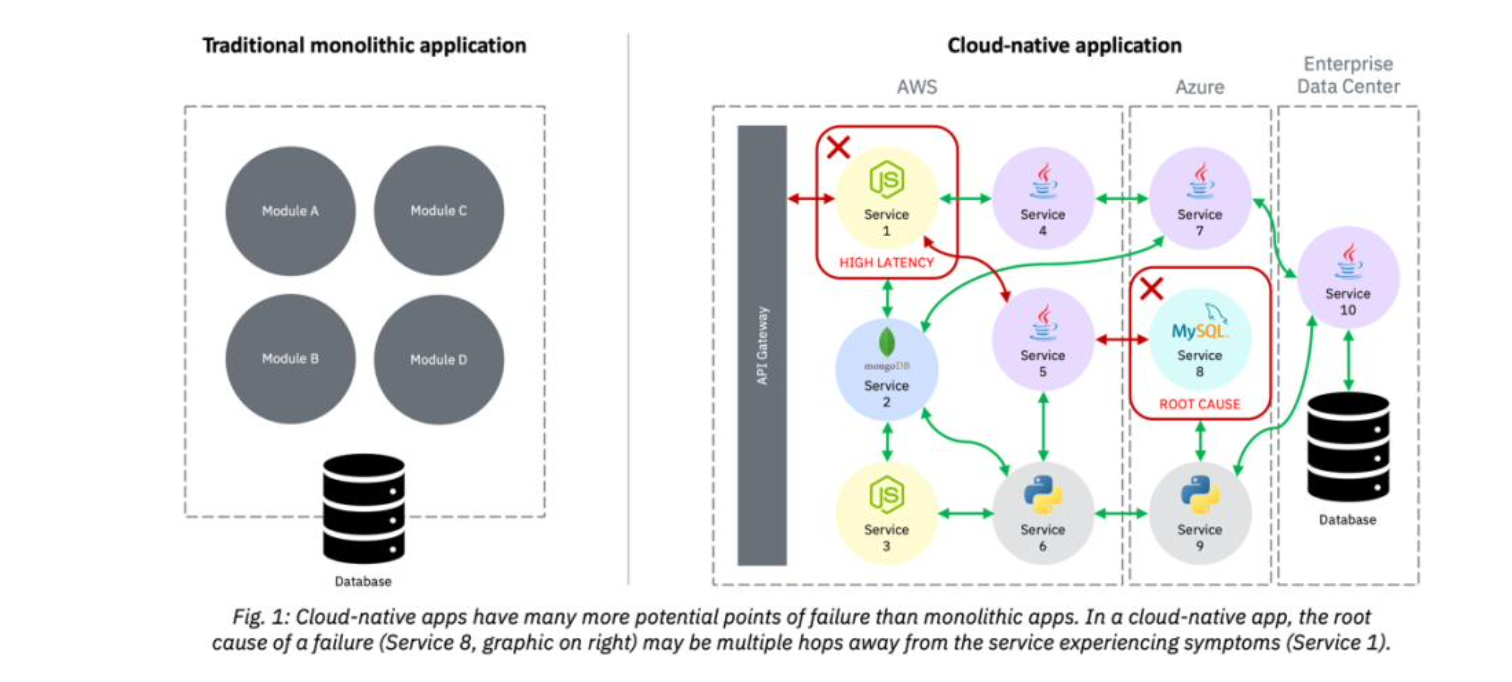
Cloud-native apps require a new approach – one that not only monitors metrics but, perhaps more importantly, traces requests that traverse across services. The context provided by these traces, when combined with metrics and other traditional measures (e.g., logs, events), delivers a view into the health of the application that metrics alone can’t provide. This new approach – referred to as observability – provides insights into root cause analysis that traditional APM tools do not. The figure below illustrates why monitoring cloud-native apps is fundamentally different than traditional apps.
Let’s look at some key reasons to use observability to monitor cloud-native applications.
Metrics alone aren’t enough to understand the health of cloud native applications.
While metrics have been fine for static, monolithic applications, cloud-native apps are more dynamic. Metrics capture the approximate state of a component aggregated over time. Dynamic systems, however, are characterized by changing service relationships, shifting topological structures and fine-grained request flows – all of which introduce new data points that necessitate a more complete perspective of the cloud-native operational environment. This more complete perspective is critical to quickly identifying the root cause of an issue in a cloud-native application.
By providing granular operational data in context, observability can help end the ‘blame game.’
In today’s IT world, many problems are solved in expensive (and annoying) war-rooms in which IT operations teams try to prove their own innocence while pointing fingers at any team that doesn’t have a solid defense (“It’s got to be the database.” “The network is the problem.” “Go check the code.”). Debugging should be a purely data-driven exercise, in which the operational data serves as the single source of truth that cross-functional teams use to analyze and uncover the root cause of a failure. By being able to trace every request that traverses the system, observability provides the granular detail needed to base the analysis on facts – rather than assumptions and guesswork.
APM is about knowing WHAT happened. Observability is about understanding WHY it happened.
APM tools leverage metrics to determine ‘what’ has gone wrong. Such an approach is inherently symptom-oriented and reactive, because, while it highlights the failing component, the actual burden of identifying the probable cause becomes a highly manual and ‘artistic’ endeavor. Observability, on the other hand, is more cause-oriented, using machine learning to continuously correlate operational data to understand ‘why’ things happened. This is often referred to as context – and is perhaps the most significant enabling capability in observability that accelerates root cause analysis.
Capturing every request – without sampling – provides key granular detail about ‘hotspots.’
Requests in a cloud-native app are like pixels in a picture; they provide the granular resolution needed to see the details. If you remove half the pixels, you start to reduce the resolution. As you continue to remove pixels, the picture gets even fuzzier. (Think of a low-resolution image where the text is blurry when you try to zoom in.) When an application fails, a lot of the important detail is documented in that high-resolution ‘fine print.’ We recommend capturing ALL traces that move through the system, without reducing the resolution and detail by sampling only a subset of traces.
Operational data must be ingested at execution time – not after a failure has occurred.
Cloud-native systems are ephemeral – hence, the state of the system may not be available when you go to debug the issue. Relevant telemetry data must be collected at execution time or it will be difficult to reproduce. Containers may get restarted or nodes may get suspended, making future
debugging impossible without evidence in hand. While analyzing logs for patterns is helpful, it’s the ability to replay telemetry data to reconstruct or iteratively investigate past situations that is truly invaluable.
Software must be smart enough to only interrupt human operators on user-impacting issues.
There are a multitude of things that can go wrong in a cloud-native deployment. However, cloud- native platforms, like Kubernetes, come with built-in capabilities to route around failures. Attempting to be aware of, and respond to, every instance of a static threshold being exceeded is a recipe for failure that will result in alert fatigue – with real alerts getting buried amidst the noise. Dynamic thresholds, on the other hand, leverage machine learning to understand baseline behavior. Using dynamic thresholds, observability software is smart enough to only send alerts on deviations from normal patterns – not simply when a static (i.e., dumb) threshold has been exceeded. Interrupting human operators should be taken seriously – since people are the mostly costly and least scalable resource in an IT environment – and should only be done when end users are directly impacted.
Wrapping it up
Enterprise computing is undergoing a fundamental shift that impacts every aspect of how applications are created, delivered, and changed. A software solution that is a collection of microservices – many of which are owned by different groups, updated on different schedules, and hosted on different systems – must be monitored very differently than a traditional application. While we’ve used the word “distributed” for years, the ultra-distributed nature of microservices-based applications gives a whole new meaning to the term.
Traditional APM tools don’t provide the necessary data, or analytics, to meet the needs of these ultra-distributed applications. Without observability, every outage can turn into a battle in which each service owner is focused on defending their team. Observability provides the granular data, and the contextual insight about that data, to understand and monitor applications in a cloud-native world.
____
Make sure to RSVP for our Monday, June 19th live Q&A session.
#automation-featured-area-1
#automation-highlights-home#observability