This blog is part of a series. For the whole series list see here
Scenario 3 – Load balancing and Autoscaling a simple App Connect flow
In Scenarios 2a and 2b we showed different ways of deploying an App Connect flow onto containers on OpenShift – via the command line, and via the dashboard. We eventually saw a response from our deployed integration, but so what! We haven’t yet really seen what Kubernetes is bringing to the table. We will now explore some of the things that Kubernetes significantly simplifies and extends compared to traditional deployments. In this scenario, we’ll specifically look at load balancing and autoscaling.
If you feel you already understand basic load balancing and autoscaling in Kubernetes, perhaps take a look at the Advanced Scaling Topics section at the end of this post.
Kubernetes and load balancing
Load balancing itself is not new, and simply refers to efficiently distributing incoming network traffic across a group of servers. It serves two primary purposes, enabling high availability, and allowing us to scale up 'horizontally' by adding further servers. It has more uses too; for example when we come to roll out new versions of our code, the load balancing can enable us to do that without downtime.
In our scenario, the servers are integration servers running the integration flows. For our simple flow, it is only incoming HTTP traffic that we need to balance across them. We will look at other types of incoming traffic in future scenarios.
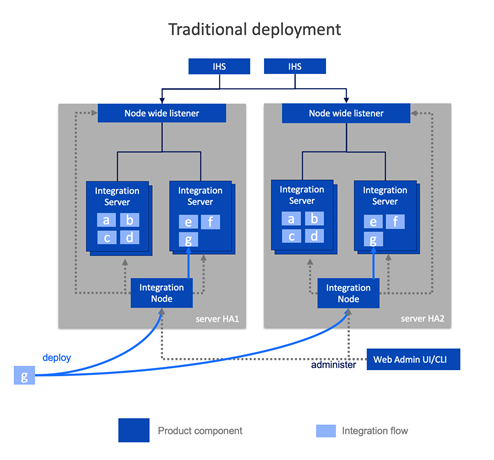
In a traditionally deployed environment, for example directly on virtual or physical machines, load balancing was something that had to be explicitly set up by those installing the product and setting up the topology. You would likely need to set up an HTTP server to spray the requests across a statically configured set of integration servers. Since there might be multiple integration servers per machine, you might choose to have integration nodes receive the HTTP traffic and then configure those to spread the work to the underling integration servers. Furthermore, you have to maintain this setup if you added more servers, or re-locate them to other network locations. That’s a lot of configuration, with a lot of specialism required around HTTP servers, and the integration nodes and servers to set it all up and look after it. Those skills aren’t hugely transferable to other products as much of it is specific to the this particular runtime.
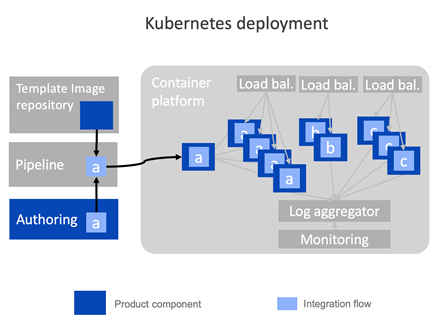
Some would say Kubernetes was originally created to simplify routing. When you deploy onto a Kubernetes environment, you don’t configure load balancing yourself, you just tell Kubernetes how many replicas of your container to create. Kubernetes then takes on the problem of creating those replicas, balancing the incoming requests between them, and re-configuring those routes if new replicas are added, or old ones stop working (and indeed re-instating the failed ones, and much, much more…).
Since IBM App Connect Enterprise v11 it has been possible to run integration servers standalone (without an associated integration node). So the recommended approach is that each container runs a single integration server, and Kubernetes completely owns the routing of traffic between container replicas.
It’s hard to overstate just how different this is to traditional environments. It means setting up load balancing is something that happens implicitly, and largely invisibly at deployment time rather than something that must be done in advance as a separate infrastructure step. This provides enormous opportunity in terms of such things as more agile approaches in the development lifecycle, the consistency of the deployment pipeline, and the simplification of skills required to operate the environment.
What is a “pod” in Kubernetes
If we’re going to talk about load balancing in Kubernetes, we’re going to need to know a new term. Kubernetes always deploys containers in what’s known as a “pod”. Often there is only one container per pod, although it is possible to have more than one. A pod is the unit of deployment. You can’t deploy part of a pod, only a whole one. Of most relevance to this post is that when you scale up, you create multiple identical pod replicas. So from this point on, when you hear us talking about “load balancing across pods”, or “pod replication”, you can roughly translate pods to containers, at least for the purposes of this post. You can read more about pods here.
Showing load balancing in App Connect on OpenShift
To demonstrate load balancing across multiple copies of a pod for a given integration server, we will deploy a simple HTTP flow that responds with a message to say which pod the flow ran in. We will deploy this flow to 3 replicas, then make multiple requests to the flow and watch the load balancing spread the requests across the replicas.
The BAR file and other related artifacts for this scenario can be downloaded from https://github.com/amarIBM/hello-world/tree/master/Samples/Scenario-3
The following is the YAML definition file for our deployment.
apiVersion: appconnect.ibm.com/v1beta1
kind: IntegrationServer
metadata:
  name: load-balance-demo
  namespace: ace-demo
  labels: {}
spec:
  adminServerSecure: false
  barURL: >-
    https://github.com/amarIBM/hello-world/raw/master/EchoServiceLoadBalancing.bar
  configurations:
    - github-barauth
  createDashboardUsers: true
  designerFlowsOperationMode: disabled
  enableMetrics: true
  license:
    accept: true
    license: L-KSBM-C37J2R
    use: AppConnectEnterpriseProduction
  pod:
    containers:
      runtime:
        resources:
          limits:
            cpu: 300m
            memory: 350Mi
          requests:
            cpu: 300m
            memory: 300Mi
  replicas: 3
  router:
    timeout: 120s
  service:
    endpointType: http
  version: '12.0'
Save this Integration CR definition as IS-github-bar-3-replica.yaml.
Key things to note;
- The replicas parameter is set to 3 to ask Kubernetes (OpenShift) to create three “pods” for this integration server.
- We are referring to a different BAR file in the barURL parameter compared to our earlier scenarios.
- We will be pulling the BAR file from the same public Git Hub repository that we used in Scenario 2a, so we are linking to the same github-barauth configuration object.
We need to ensure the barauth configuration object is in place. Refer to the instructions for Scenario 2a for what this file should look like then apply it with the following command.
# oc apply -f Config-barAuth.yaml
configuration.appconnect.ibm.com/github-barauth created
Now create the Integration Server with instructions for 3 replica pods.
# oc apply -f IS-github-bar-3-replica.yaml
integrationserver.appconnect.ibm.com/load-balance-demo created
Upon successful deployment, you will see 3 pods for your integration server using following command:
# oc get pods
load-balance-demo-is-86f656c7cf-dd74h               1/1     Running     0          35m

load-balance-demo-is-86f656c7cf-gvgzm               1/1     Running     0          35m

load-balance-demo-is-86f656c7cf-kvb77               1/1     Running     0          35m
Get the public endpoint for your message flow service using ‘routes’
# oc get routes
load-balance-demo-http load-balance-demo-http-ace.apps.cp4i-2021-demo.cp.com load-balance-demo-is
Since we have deployed IS with 3 replicas, we expect the messages to be distributed to each of the pods equally by the K8s service/load balancer.
So we send 6 messages to the message flow on the public URL obtained from the routes above. (Message flow is listening for incoming requests on endpoint /Echo).
Therefore our URL becomes : http://load-balance-demo-http-ace.apps.cp4i-2021-demo.cp.com/Echo
The message flow has been modified from earlier scenarios to output the pod name and pod IP address to allow us to know which pod the response has come from.
Output
# seq 1 6 | xargs -n1 curl -X POST http://load-balance-demo-http-ace.apps.cp4i-2021-demo.cp.com/Echo
This response is from pod: load-balance-demo-is-86f656c7cf-gvgzm/10.254.13.190       Current time =  2021.11.19:10-56-18

This response is from pod: load-balance-demo-is-86f656c7cf-dd74h/10.254.16.54       Current time =  2021.11.19:10-56-20

This response is from pod: load-balance-demo-is-86f656c7cf-kvb77/10.254.25.79       Current time =  2021.11.19:10-56-21

This response is from pod: load-balance-demo-is-86f656c7cf-gvgzm/10.254.13.190       Current time =  2021.11.19:10-56-23

This response is from pod: load-balance-demo-is-86f656c7cf-dd74h/10.254.16.54       Current time =  2021.11.19:10-56-24

This response is from pod: load-balance-demo-is-86f656c7cf-kvb77/10.254.25.79       Current time =  2021.11.19:10-56-26
As you can observe the output above, we sent 6 requests to the message flow using curl command. Each of the 3 pods has served 2 of the requests, so the load balancing is working.
You can also verify using the pod logs that each IS pod has received and processed the request
# oc logs load-balance-demo-is-86f656c7cf-gvgzm
2021-11-19 10:56:18.134     62 This response is from pod: load-balance-demo-is-86f656c7cf-vgzm/10.254.13.190       Current time =  2021.11.19:10-56-18

2021-11-19 10:56:23.417     62 This response is from pod: load-balance-demo-is-86f656c7cf-vgzm/10.254.13.190       Current time =  2021.11.19:10-56-23
# oc logs load-balance-demo-is-86f656c7cf-dd74h
2021-11-19 10:56:20.131     61 This response is from pod: load-balance-demo-is-86f656c7cf-dd74h/10.254.16.54       Current time =  2021.11.19:10-56-20

2021-11-19 10:56:24.234     61 This response is from pod: load-balance-demo-is-86f656c7cf-dd74h/10.254.16.54       Current time =  2021.11.19:10-56-24
# oc logs load-balance-demo-is-86f656c7cf-kvb77
2021-11-19 10:56:21.538     63  This response is from pod: load-balance-demo-is-86f656c7cf-kvb77/10.254.25.79       Current time =  2021.11.19:10-56-21

2021-11-19 10:56:26.637    63  This response is from pod: load-balance-demo-is-86f656c7cf-kvb77/10.254.25.79       Current time =  2021.11.19:10-56-26
This demonstrates that the requests are being spread across all the pods evenly using the default round robin distribution.
Auto Scaling
When you first deploy your application to a Kubernetes cluster, you may not be sure about its resource requirements in different situations and usage patterns. Equally you may know that the inbound workload varies significantly. Perhaps there is a low workload most of the time, but occasional much higher peaks.
So far in our definition for integration servers, we have only been able to specify a fixed number of replicas. In this section we will show that you can add scaling policies to ensure that your workload scales up and down with demand, and thereby functions consistently in different situations without needing to over provision the capacity to cater to some occasional peak loads.
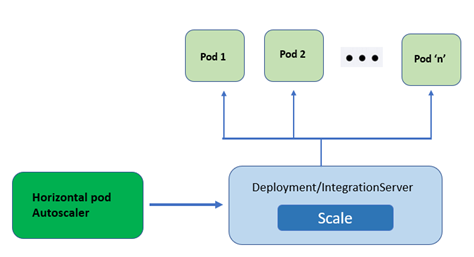
You can create a horizontal pod autoscaler (HPA) to specify the minimum and maximum number of pods you want to run, as well as the CPU utilization your pods should target. At the end of the post we’ll also discuss some more advanced scaling options.
The real magic here is that the load balancing we looked at in the beginning of this post, will dynamically follow the autoscaling and seamlessly spread the load across the available replicas without the need for any further configuration.
In order to demonstrate the autoscaling feature in context of the App Connect certified container, we will create an Integration Server and associate that with an HPA policy in our OpenShift cluster. If you don’t have time to perform the below exercise there is an excellent demonstration of the capability in a previous video. Feel free to return here afterwards to understand what’s happening under the covers.
Create an Integration Server with fixed replication
We will first create an Integration Sever that has a fixed replication policy of one replica.
apiVersion: appconnect.ibm.com/v1beta1
kind: IntegrationServer
metadata:
  name: auto-scale-demo
  labels: {}
spec:
  adminServerSecure: false
  barURL: >-
    https://github.com/amarIBM/hello-world/raw/master/AutoScaleApp.bar
  configurations:
    - github-barauth
  createDashboardUsers: true
  designerFlowsOperationMode: disabled
  enableMetrics: true
  license:
    accept: true
    license: L-KSBM-C37J2R
    use: AppConnectEnterpriseProduction
  pod:
    containers:
      runtime:
        resources:
          limits:
            cpu: 300m
            memory: 350Mi
          requests:
            cpu: 300m
            memory: 300Mi
  replicas: 1
  router:
    timeout: 120s
  service:
    endpointType: http
  version: '12.0'
Save this to a file named IS-github-bar-autoscaling.yaml
Note that the no. of replicas is set to 1 and cpu limits to a maximum of 300m (millicores) – a third of a cpu.
IMPORTANT: Our bar file for this scenario is once again on Git Hub, so don’t forget that we need to create a barauth “configuration” object that defines the credentials. The instructions for this are in Scenario 2a.
Now let’s deploy the new integration server.
# oc apply -f IS-github-bar-autoscaling.yaml
integrationserver.appconnect.ibm.com/auto-scale-demo created
Add a Horizontal Pod Autoscaler
Now we’re going to create an Horizontal Pod Autoscaler (HPA) policy that targets the integration server we just deployed (auto-scale-demo). The policy will state that the integration server should be scaled up if the CPU utilisation of a pod reaches 80% of the allocated CPU. It will also state that the maximum number of replicas to scale to up to (maxReplicas) is 3. Recall that in our integration server definition above, we set the CPU to 300m (millicores of cpu), so if the CPU of any POD reaches 240 millicores, the auto scalar will kick in and start replicating.
Following is the YAML definition of HPA that we will create in our cluster. Save this in a file named ace_autoscaler_policy.yaml
apiVersion: autoscaling/v1
kind: HorizontalPodAutoscaler
metadata:
  name: ace-auto-scaler
  namespace: ace-demo
spec:
  scaleTargetRef:
    kind: IntegrationServer
    name: auto-scale-demo
    apiVersion: appconnect.ibm.com/v1beta1
  minReplicas: 1
  maxReplicas: 3
  targetCPUUtilizationPercentage: 80
Important fields to note:
- kind: IntegrationServer - The type of object we are applying the HPA policy to. In our case, it is Integration Server.
- name: auto-scale-demo – The name of Integration Server to apply the HPA policy.
- minReplicas: 1 - The minimum no. of replicas to be maintained irrespective of CPU utilization.
- maxReplicas: 3 – The max no. of replicas to scale up to.
- targetCPUUtilizationPercentage: 80 - The threshold point at which HPA will trigger additional replicas.
# oc apply -f ace_autoscaler_policy.yaml
horizontalpodautoscaler.autoscaling/ace-auto-scaler created
Check the status of HPA using following command
# oc get HorizontalPodAutoScaler
NAME              REFERENCE                           TARGETS         MINPODS   MAXPODS   REPLICAS   AGE

ace-auto-scaler   IntegrationServer/auto-scale-demo   <unknown>/80%   1         3         1          49s
TARGETS : Shows the threshold cpu value that has been configured .
MINPODS : min pods to scale down to.
MAXPODS : max pods to scale up to.
REPLICAS : current no. of replicas in effect.
Stress test in order to see autoscaling
Let's stress test the message flow by sending a high volume of messages so that it drives high CPU usage. We used the SoapUI tool to generate the load for the messageflow. You may however use any other tool that is available to you and is capable of generating load for the target HTTP endpoint.
When the CPU utilization goes beyond 80% it will spin up new pods until it is able to balance the CPU utilisation within the defined trigger limit within the current set of pods. It will stop scaling when it reaches MAXPODS regardless of the CPU utilization.
In this example, we can see that the POD’s CPU utilisation reached above the trigger limit so HPA has spawned an additional two pods (max total pods 3 as per the policy)
# oc get HorizontalPodAutoScaler
NAME              REFERENCE                           TARGETS    MINPODS   MAXPODS   REPLICAS   AGE

ace-auto-scaler   IntegrationServer/auto-scale-demo   143%/80%   1         3         3          34m
You can see the scaling up activity in the openshift event log as well.
# oc get events
31m         Normal    SuccessfulCreate         replicaset/auto-scale-demo-is-7c5bb8b594              Created pod: auto-scale-demo-is-7c5bb8b594-hxx8q
2m          Normal    SuccessfulCreate          replicaset/auto-scale-demo-is-7c5bb8b594              Created pod: auto-scale-demo-is-7c5bb8b594-mm8hl
2m          Normal    SuccessfulCreate          replicaset/auto-scale-demo-is-7c5bb8b594              Created pod: auto-scale-demo-is-7c5bb8b594-68fzg
38m         Normal    ScalingReplicaSet         deployment/auto-scale-demo-is             Scaled up replica set auto-scale-demo-is-7c5bb8b594 to 1
31m         Normal    ScalingReplicaSet         deployment/auto-scale-demo-is             Scaled up replica set auto-scale-demo-is-7c5bb8b594 to 1
2m          Normal    ScalingReplicaSet          deployment/auto-scale-demo-is             Scaled up replica set auto-scale-demo-is-7c5bb8b594 to 3
# oc get pods
auto-scale-demo-is-7c5bb8b594-68fzg                 1/1     Running     1          62s

auto-scale-demo-is-7c5bb8b594-hxx8q                 1/1     Running     1          30m

auto-scale-demo-is-7c5bb8b594-mm8hl                 1/1     Running     1          62s
Now we stop the stress test activity and keep the message flows idle or with very minimal volume of messages for some time. The HPA will recognize that the IS does not need 3 replicas for the amount of load currently it has, so it will scale it down to 1 replica.
# oc get HorizontalPodAutoScaler
NAME              REFERENCE                           TARGETS   MINPODS   MAXPODS   REPLICAS   AGE

ace-auto-scaler   IntegrationServer/auto-scale-demo   2%/50%    1         3         1          43m
# oc get events
71s Normal ScalingReplicaSet deployment/auto-scale-demo-is Scaled down replica set auto-scale-demo-is-7c5bb8b594 to 1
#oc get pods
auto-scale-demo-is-7c5bb8b594-hxx8q 1/1 Running 1 40m
We began this article discussing load balancing. Did you notice that Kubernetes automatically adjusted the load balancing to spread the load across however many replicas were available. You didn’t have to do a thing!
How does autoscaling really work, and what does this tell us about Kubernetes?
Autoscaling and the associated dynamic load balancing works because HPA is just using the core underlying Kubernetes functionality. When the HPA sees a need to scale up or down, it edits the “replica” value in the integration server definition to a new value. The rest is regular Kubernetes activity. Kubernetes is constantly monitoring the definitions for changes. When it sees a change in the replica count it attempts to make the actual deployment match the definition, adding or removing a replica. It doesn’t know or care whether it was an HPA that made the change, or you running a command line, or editing the definition in the web console; it’s all the same to Kubernetes.
This idea of matching the current state with a “to-be” state is fundamental to how Kubernetes works, and is one of its strongest assets. It means the state of an environment can be completely described using definition files which could (and probably should…) be stored in a source control repository. This enables us to completely, and reliably re-create an environment from scratch on any Kubernetes platform.
Compare this to a traditional environment, that was perhaps built several years ago and has had multiple in-situ updates since that are lost in the mists of time. It quickly becomes hard to know for sure whether the various environments (development, test, production etc.) are actually identical, and it is extremely hard to reliably re-create an environment should you need to.
Kubernetes allows us to define our topology as “code” in a repository, and build that topology accurately from scratch at deployment time. It means our CI/CD pipeline can contain not just the code we’re deploying, but the runtime characteristics of our solution too. It even enables us to “roll back” an environment, for example to a “last known good” state.
Advanced scaling topics
Let’s finish with a look at some more advanced topics around scaling.
- Scaling from the command line: We explored creating an HPA policy as a definition file, then “applying” that to the environment to create the actual HPA. This is the recommended approach for governed environments where you are targeting an “infrastructure as code”/Git Ops approach. Its worth noting however, that there is also a dedicated command line option “oc autoscale” which is a convenience method useful for quickly experimenting with different autoscale settings. More information on that is available here in the OpenShift documentation, and here in the Kubernetes docs.
- Scaling on different metrics: We saw horizontal scaling in action, based on CPU. For obvious reasons CPU is one of the most common metrics, but Kubernetes can use other ones too. For example, there is first class support for scaling based on memory (although some aspects of this are in beta), and you can use custom metrics as well. You can find out more about the horizontal autoscaling options here.
- The autoscaling algorithm: If you’re going to use autoscaling in anger you may want to know more depth about the exact algorithm used. How does it handle pods that are being deleted or started? What does it do when it can’t retrieve metrics? How does it handle metrics that are changing rapidly? What does it do during a rolling update? It is quite sophisticated, and in some cases even customisable? More details here.
- Scaling to zero and serverless: Kubernetes on its own can’t scale to zero replicas. If it did, the next request that came in for a pod would fail. However, with a little assistance, Kubernetes can scale to zero using “severless” frameworks such as Knative, and KEDA. Knative watches incoming network traffic such as HTTP requests, and if no traffic comes in for a while, scales a pod down to zero replicas. If a request comes in, it holds the request at the ingress gateway whilst starting up a pod to serve it. Clearly this introduces a slight delay for the first request (note that at the time of writing an integration server can be tuned to start in 10-20 seconds) but subsequent requests will be served just as normal. There is an example of the use of Knative with IBM App Connect Enterprise in the these demo materials. KEDA does much the same thing, but for asynchronous traffic arriving for example on MQ queues or Kafka topics. We have written an open source “scalar” to enable MQ with KEDA and there are scalars for Kafka too. These frameworks can be used to ensure minimum deployment of integration servers during quiet periods to optimize infrastructure and licensing.
- Vertical pod autoscaling: Kubernetes also contains a Vertical Pod Autoscaler (VPA). This means rather than introducing, or removing replicas, it instead changes the amount of CPU available to each pod. This is a fairly advanced topic and much more nuanced than horizontal scaling. It is worth noting that to change the CPU allocations to a pod the VPA has to remove replicas, then reinstate them, making it quite a significant change. It is primarily a tool for administrators, who can use it to better utilize cluster resources, such as preventing pods from reserving more CPU resources than needed. More details are here.
Acknowledgement and thanks to Kim Clark for providing valuable inputs to this article.
#IntegrationBus(IIB)#AppConnectEnterprise(ACE)#Docker#redhatopenshift #App-Connect-Operator