When I was teaching a FinOps class recently I got asked how to tell what your real savings are when you purchase an AWS RI. I was a little confused by what they were asking at first, but then I got it. They wanted to not only know how much their savings would be from RI usage, they also needed to amortize out the expense of purchasing the RI to see where their breakeven point was. Thankfully this is a question that the Cloudability application has already answered so I didn't have to think of an example off the cuff. I got to show it live!
In Cloudability I'm using the Reserved Instance Planner, you can find it under the Optimize section of the navigation pane. Since I wanted to start with the RI that would give me the best savings I changed the %Savings column to sort Descending. I can see pretty quickly that a 45% savings on some m1.small instances looks like a great place to start.

I clicked on the details button next so I could see the cost breakdown chart using the Future Savings setting. Here's the chart:
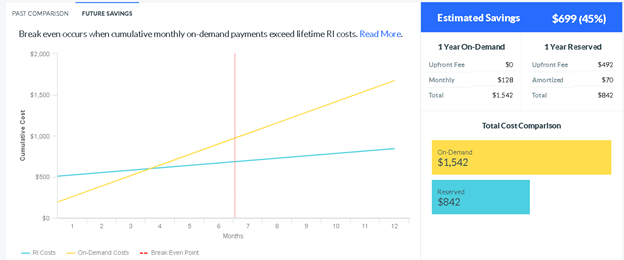
Take a look at the OnDemand and RI costs lines… see where they intersect about 4 months in? That is the breakeven point. Add a relatively quick return on investment to the $700 I'll be saving on using on-demand and I'm a happy camper. Not bad! This seems like a solid purchase that will show a good return quickly. I also really enjoyed the article this section linked from JR Storment on RI Coverage and Waste. It's definitely worth the read!
------------------------------
Justin Kean
Apptio
Instructor
------------------------------
#Cloudability