Hi Hamish,
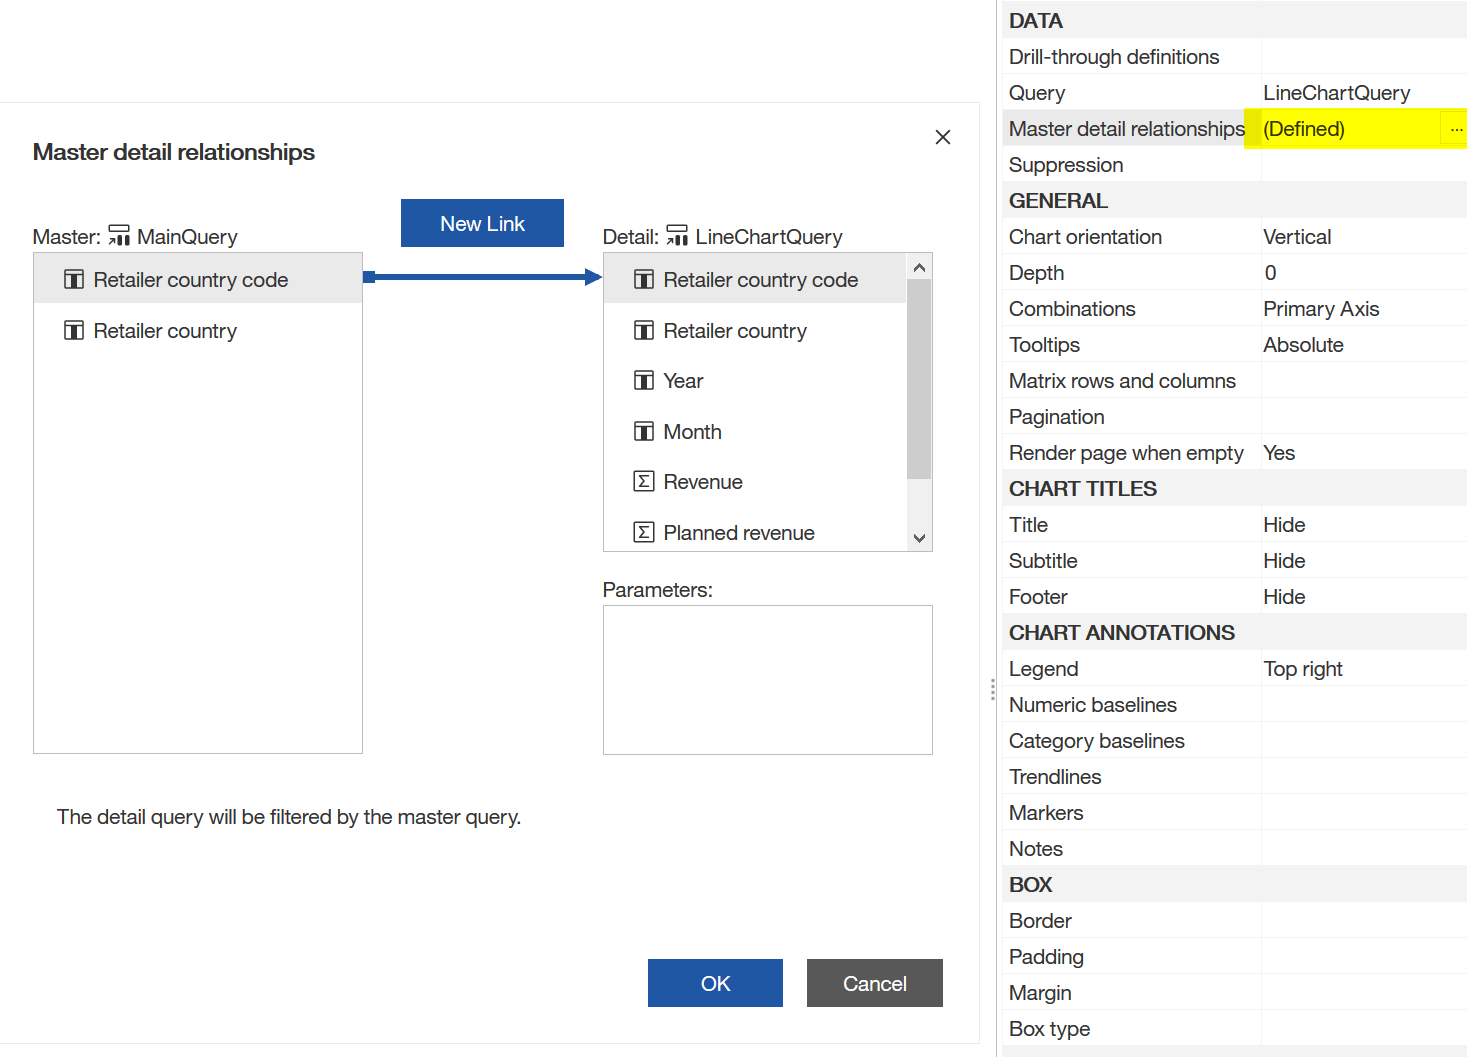
this is done with master detail relationships.
You can link all data containers to the same query or set up independent queries for each container. Just make sure that the necessary group data item is available in all queries.
Here's an example with a page group by country code. The page brake uses the "MainQuery" and the line chart adn crosstab have their own query. both are then linked together with an master detail relationship. which means for each data row from the corresponding table column, a separate crosstab & line chart will be rendered on the page.


If you don't use a page set, you can also create regular list with the members which should be used for the separation of the crosstab and chart. Then insert the crosstab and chart als additional columns into the list and define the master detail relationship.
I reccommend this article:
https://www.ibm.com/docs/en/cognos-analytics/11.1.0?topic=wdq-create-master-detail-relationship------------------------------
Robert Dostal
Team Leader BI
GEMÜ
Ingelfingen
------------------------------
Original Message:
Sent: Mon July 05, 2021 09:07 PM
From: Hamish Browne
Subject: Crosstab relationship to other visualizations when page breaking
Hi
Is it possible to filter another visualization (on the same page) by the data currently displayed in a crosstab which is set to page break on an member?
e.g. If on page one a cross tab is displaying data for a certain country, then a bar graph would show only data for that country. Page two will display information for the next country in both the crosstab and bar graph.
Cheers
------------------------------
Hamish Browne
------------------------------
#CognosAnalyticswithWatson