Stories are an effective way to present and share your data. In this tutorial, you will learn how to create a story, an outline, and how to animate a scene.
By the end of this tutorial, you will be able to create a story with a scene, similar to the scene below:
While there are no rules for how you can create a story in IBM Cognos Analytics, this tutorial will provide you with a sense of the workflow involved in creating a story. The following is the workflow that this tutorial uses in creating a story:
- Create a new story
- Create an outline
- Populate the scenes
- Adjust the timeline
- Add animations
Create a new story
Start off by creating a new slideshow story. Slideshow are simple, flexible, and resemble more traditional presentations. Once you're familiar with how the slideshows work, you can experiment with other story transition types.
- Click the New icon, located in the side bar.
- Click Story.
- Select Slideshow.
- Click Create.
And now, your new slideshow-style story is created. The story is where you will add your scenes.
Next, you will begin to organize your ideas into an outline. You will be using scenes to create this outline.
Create an outline
To keep your points organized, you can create a simple outline for your story by using scenes. For example, your outline might roughly consists of the following:
- An introduction
- The company business model
- A history of past performances
- A conclusion / future goals
For each of these points, create a scene and name the scene accordingly.
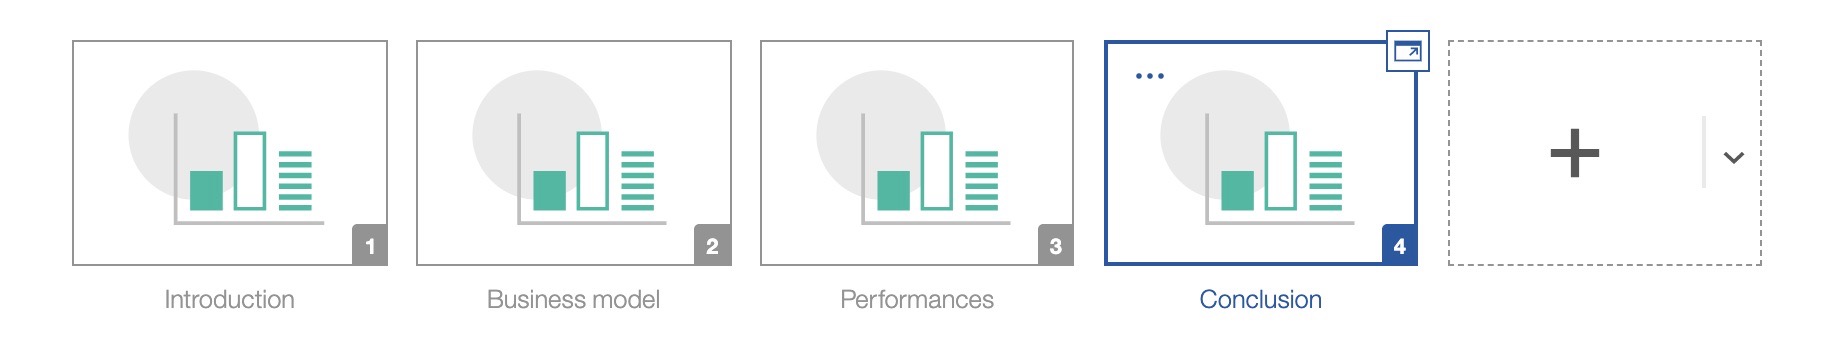
- Click the Scene selector icon to open the scene selector.
- Click the Add a new scene with default template icon.
The
Scene Selector bar should now be populated with scenes, outlining your story. You can add or delete scenes later where you see fit.
After you have an outline for your story, it's time to start populating your scenes with data and widgets.
Populate the scenes
After you have created an outline for your story, you can now begin to compose your scenes. The composition of your scene is important. The canvas of your scene should not be too crowded and the placement of the widgets should guide the viewer's eye towards important information.
At this stage, don't worry about adding entry and exit animations. You want to work on the final composition of your elements and how they will look on the screen.
- Click the Edit or preview icon and ensure that you are in edit mode.
- From the scene selector, click the scene that you want to populate.
- Use the left pane to select widgets or visualizations to add to your canvas.
- Rearrange the widgets and visualizations.
- When you are done with the composition of the canvas, click the Full screen icon to view it in full screen. If your composition looks distorted in full screen, continue to adjust it in the canvas.
Here's an example of a populated scene:
 Tips
Tips:
- If you are sharing your story with other people, use the auto option for text size. This will ensure that the text scales appropriately for different screen sizes and resolutions.
- Are you having trouble fitting everything into a single scene? That might be a sign that your scene contains more than one major message and that you should split the scene into two or more scenes.
After your scene is composed and you're happy with the layout, you can begin adjusting the timeline to define when your widgets appear.
Adjust the timeline
Presenting all of your data, all at once can be overwhelming to your audience. Consider the order in which the widgets on your canvas appear.
For example, you may want to define when certain text boxes appear, if you have multiple text boxes. Controlling the time and speed in which objects appear on your canvas helps viewers to focus only on one point at a time.
By default, when you add a widget to your canvas, the corresponding timeline object is added to the beginning of the timeline. As the timeline slider moves during playback, objects that the timeline slider moves across will appear on the canvas.
Drag the individual elements in the timeline, side to side, to define when the corresponding widget will appear and disappear from the canvas.
- Click the Edit or preview icon and ensure that you are in edit mode.
- From the scene selector, click the scene with the timeline that you want to adjust.
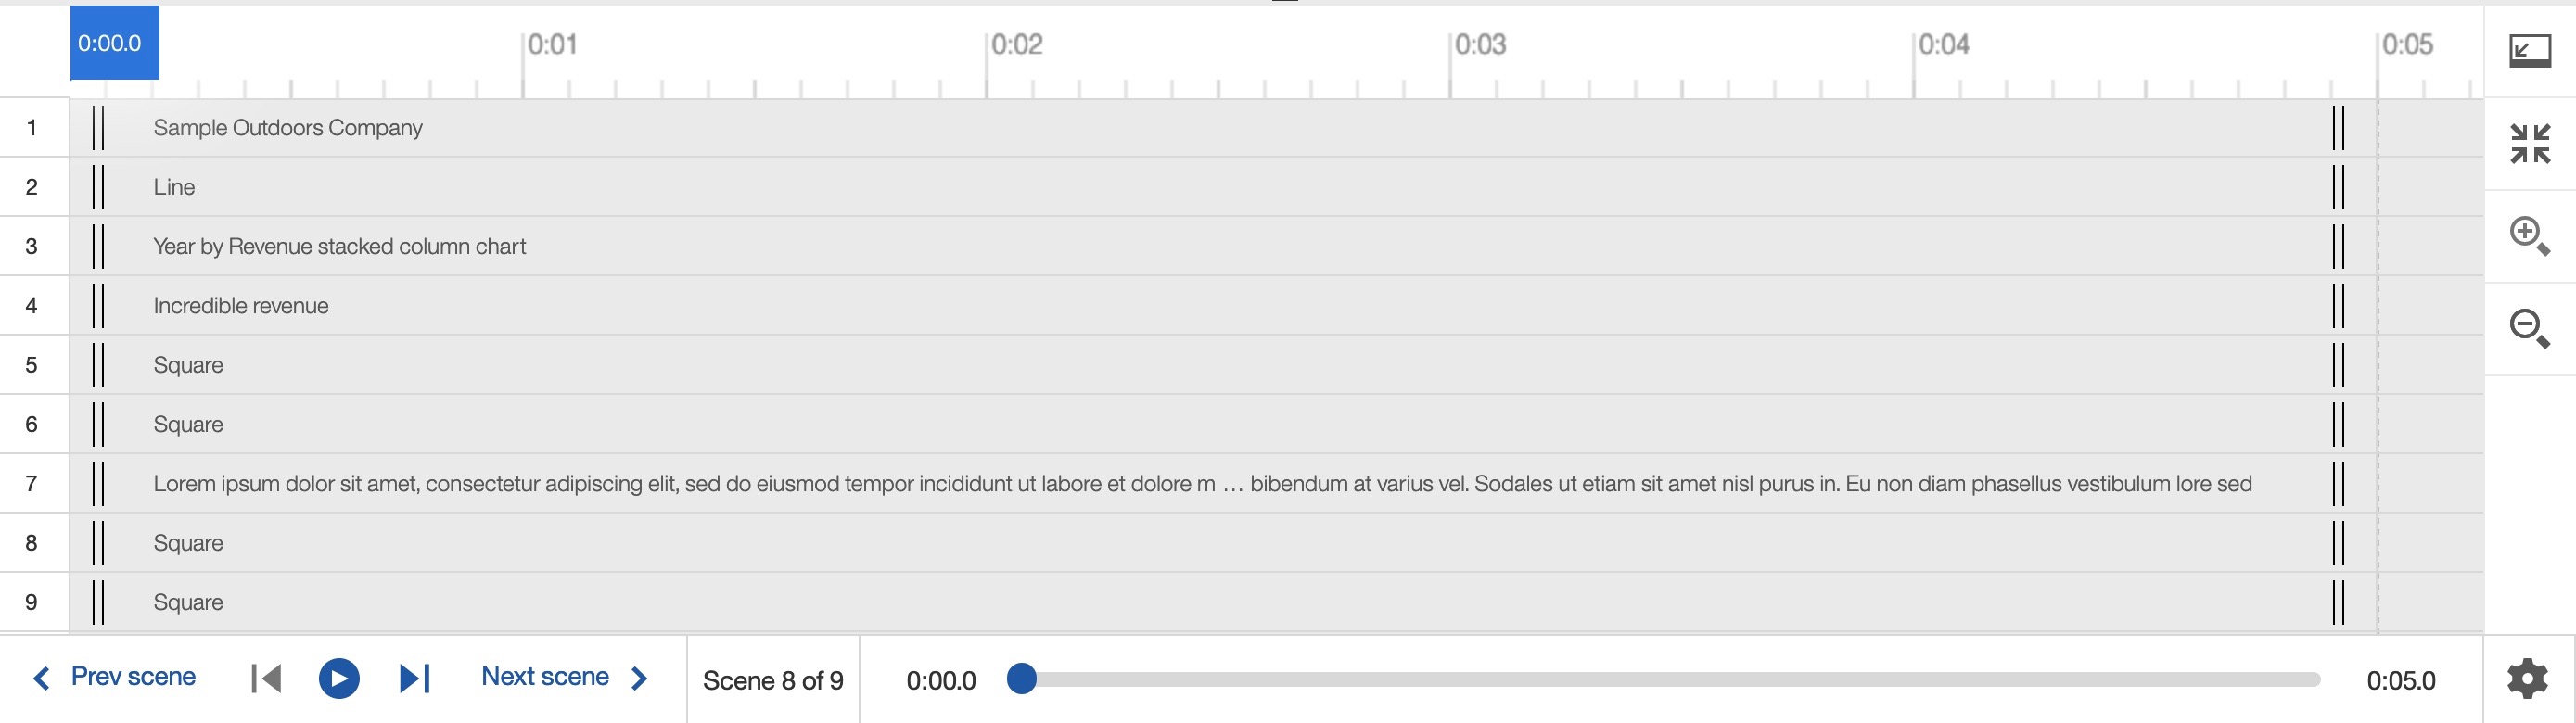
- Click the Open timeline icon.
- Drag the individual elements to position them on the timeline.
In the example below, groups of widgets are placed on the timeline to appear roughly 2 seconds apart from each other.
During playback, the widgets will appear on the canvas according to the position of the timeline slider.
Now that you have determined when your widgets appear on the canvas, it's time to use animations to define how they will appear.
Add animations
Animations can be used to make your story more dynamic and memorable. The default widget animation is the fade animation. The fade animation works in most situations. You can change this animation type, however, keep in mind that having too many different animation types can be distracting to the viewer.
Tip:
Generally, you shouldn't have elements and widgets overlapping one another when entering or exiting a scene. Based on the animation type that you choose for your widgets, you may want to pay attention to the direction in which they enter or exit.
- Click the Edit icon.
- In the bottom pane, click the Scene selector icon.
- Click the scene, which contains the element you want to add an animation to.
- Click the Open timeline icon.
- Click the element you want to add an animation to.
- Click the Open animations properties icon in the menu.
- Expand Entrance or Exit, depending on if you want to add an animation to the beginning or end of your element.
- Select the animation type from the Animation menu.
- If applicable, select the direction of the animation from the Direction menu.
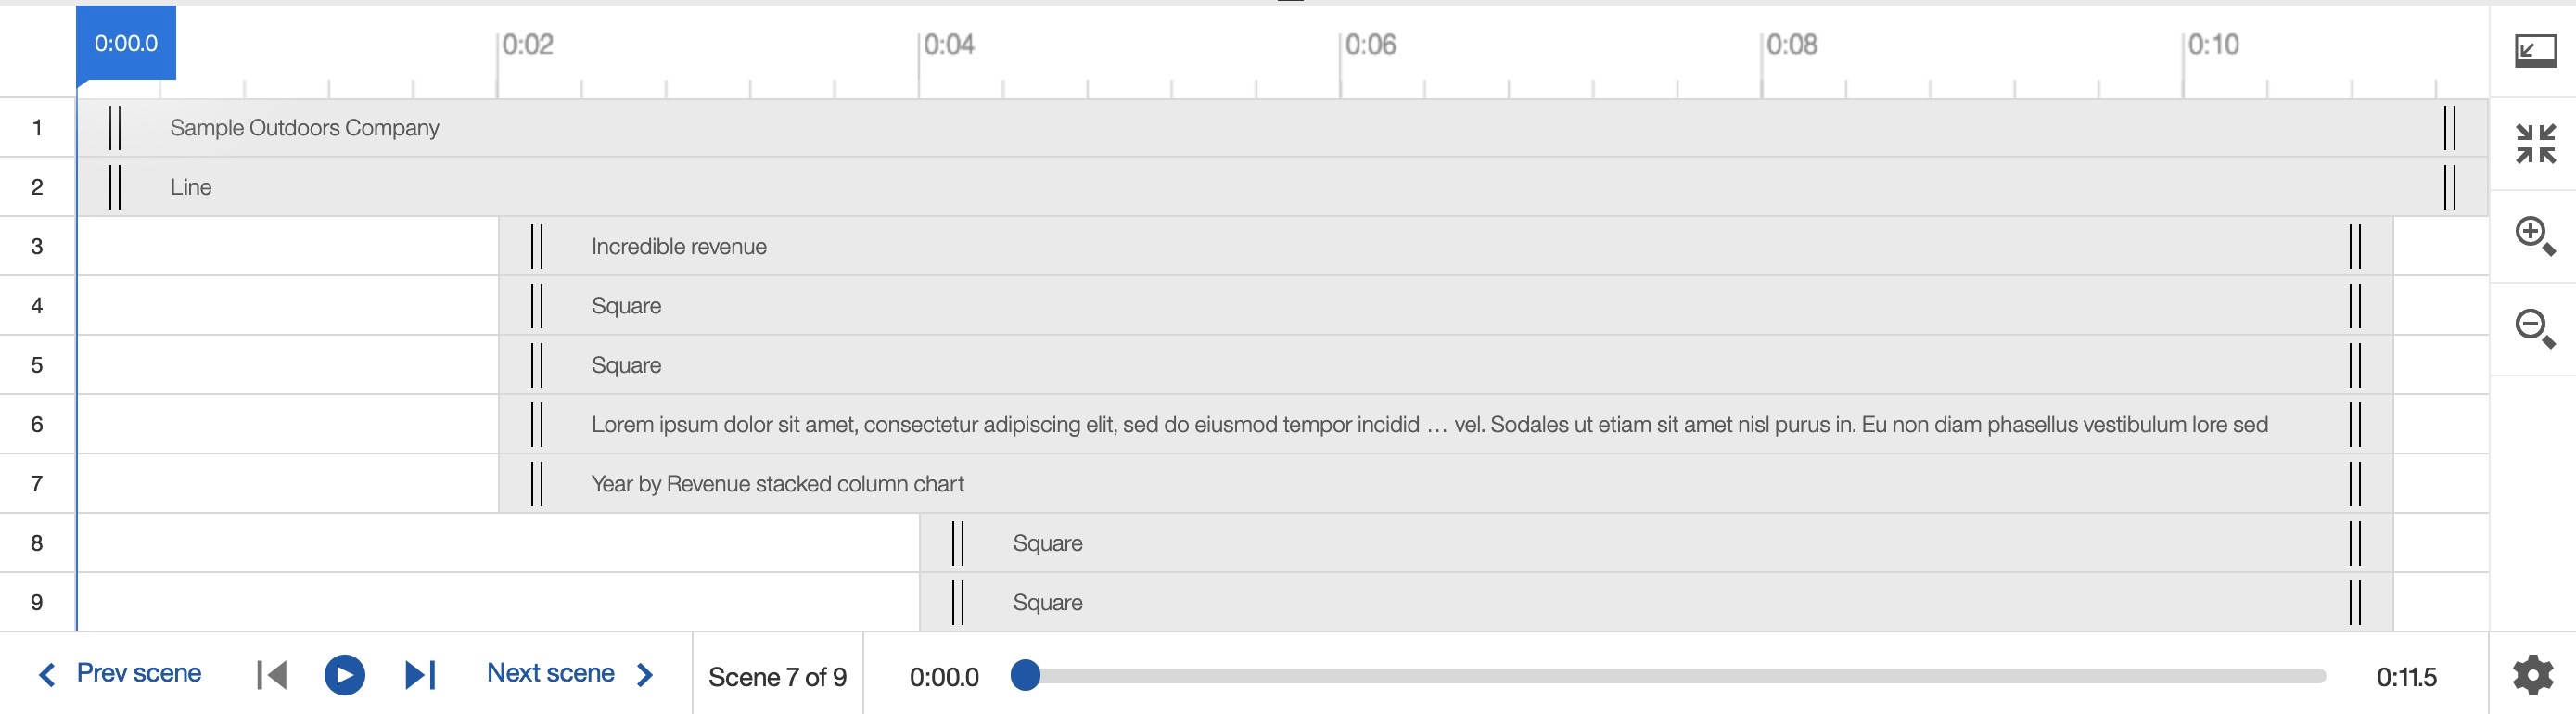
In the example below, the slide animation type was added to two of the text boxes, and the Entry animation duration for the data widget was increased.
Congratulations, you have created a story, an outline, populated a scene, adjusted the timeline, and added animations! Continue this process for the rest of your scenes. When you have finished, you can define their playback options and share your story.
For more information on IBM Cognos Analytics stories, see Stories.
For tips on getting started with IBM Cognos Analytics, see Getting started with Cognos Analytics.
#CognosAnalyticswithWatson#createstory#home#LearnCognosAnalytics#story