Originally posted by: TinaLangridge
 This blog introduces the enriched enterprise class features of the Elastic Stack, and showcases how IBM Spectrum Conductor 2.3 and the Elastic Stack work together.
IBM Spectrum Conductor provides data analytics by offering the Elastic Stack as system services. With this integration, IBM Spectrum Conductor collects Spark application data, and enables you to search, analyze, and visualize this data for efficient monitoring.
This blog is the first part of a three-part blog series:
Elastic Stack
The Elastic Stack is now the world’s most popular log analysis platform, with millions of downloads per month. The Elastic Stack is free and open source, and includes these products:
 Beats: A platform that includes various “beats”. Specifically, a Filebeat is a lightweight shipper that monitors and collects log and event data. Filebeats collect data from edge machines to Logstash and Elasticsearch.
 Logstash: A data collection pipeline that receives data, applies filters to extract and transform the data, before forwarding to various outputs including Elasticsearch.
 Elasticsearch: A distributed JSON-based search and analytics engine designed for horizontal scaling.
 Kibana: A graphical interface to visualize and navigate data within Elasticsearch.
Installation and configuration
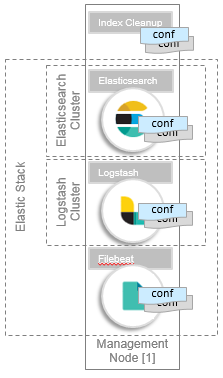
The IBM Spectrum Conductor installation includes the Elastic Stack binaries, service scripts, the Elastic Stack configurations, and installers referred to as the EGO Elastic Stack framework. This framework installs, configures, and provides a fully functional Elastic Stack. The binaries exclude Kibana, however you will learn more information about Kibana in the final blog in this series: Part 3: Leveraging Kibana to create custom visualizations.
IBM Spectrum Conductor artifacts are dropped into the framework’s directories to enable the Elastic Stack to extract, transform, and load data into Elasticsearch. These artifacts include:
- Filebeat YAML files, to identify the files to harvest
- Logstash configurations, to extract, transform, or enrich data
- Elasticsearch templates, to define the data schema
Data retention
An EGO Elastic Stack manager service (elk-manager) automates the task of purging data. The service deletes Elasticsearch indices based on an index per day timeframe. You can configure the retention period for individual index levels, or set a range of indices with wildcards. The default retention period is 14 days.
Horizontal scaling
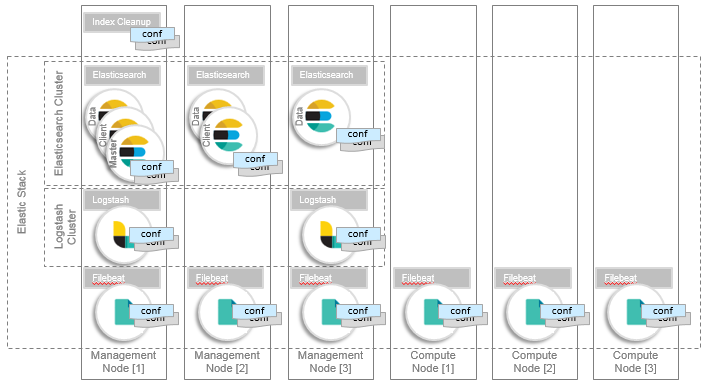
Scale according to your workload demands. The EGO Elastic Stack framework has three Elasticsearch services: elk-elasticsearch, elk-elasticsearch-data, and elk-elasticsearch-master. These services manage and scale Elasticsearch instances with dedicated roles where:
- client nodes co-ordinate queries and aggregations, and reduce data node loads
- data nodes focus on indexing and query requests
- a dedicated master node focuses on the cluster health management and keeps the master responsibilities isolated from the load
The dedicated roles allow Elasticsearch nodes to be scaled independently of each other. This provides the ability to scale the cluster to different workload patterns (heavy indexing versus heavy querying).
Similarly, the Logstash and Filebeat instances can be scaled independently.
The Elastic Stack manager service monitors the Elastic Stack so that it knows which instances are up and running. Filebeat and Logstash configurations are automatically modified so indexing and search requests are forwarded to include scaled-up instances:
Failover
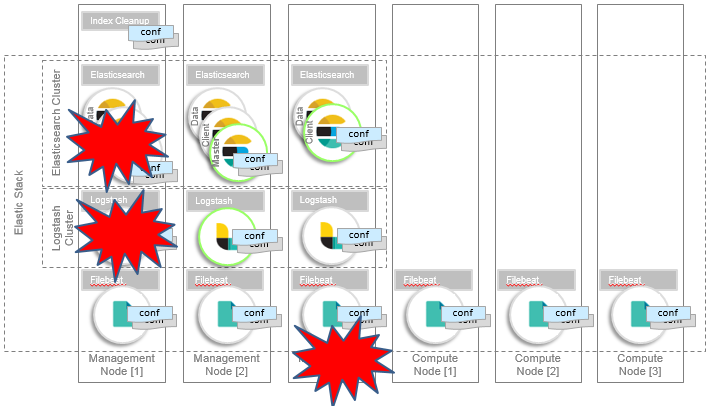
High workload, rogue queries, or malformed aggregation can cause Elasticsearch cluster instability where Elasticsearch can become unavailable, or worse, corrupt indices. Starting the nodes with dedicated roles allow the Elasticsearch master node to focus on cluster health management.
Again, the Elastic Stack manager service (elk-manager) monitors the Elastic Stack and has knowledge of which instances are up and running. Filebeat and Logstash configurations are automatically modified, so indexing and search requests are only forwarded to configured hosts with available instances:
End-to-end security with the Elastic Stack
An Elasticsearch plug-in is deployed with the Elastic Stack, offering encryption, authentication, and authorization across the Elasticsearch cluster:

For added security, you can also enable SSL for communication between Elasticsearch, Filebeat, and Logstash. You can configure SSL during or after installation.
Learn more!
Now that you have familiarized yourself with the Elastic Stack features and its integration with IBM Spectrum Conductor to search and query data, check out how to manage and analyze this data the next blog in this series: Part 2: Analyzing data with Explorer reports and its data loader for reporting.
#SpectrumComputingGroup