Originally posted by: TinaLangridge
 IBM Spectrum Conductor 2.3 offers Explorer reports, which includes a Spark Charge Back chart. The cluster management console within IBM Spectrum Conductor uses data from an Explorer reports data loader (called the Spark resource usage aggregation data loader). IBM Spectrum Conductor aggregates the data and puts the data back into Elasticsearch to make it consumable for the Spark Charge Back chart.
This blog highlights how the data loader rolls up Spark application resource metrics collected in the Spark Charge Back chart and to explore aggregations of these metrics with out-of-the box visualizations with Explorer reports.
This blog is the second part of a three-part blog series:
Collecting and storing Spark resource usage metrics
Spark resource usage metrics include allocated slots, cores, and memory. IBM Spectrum Conductor collects these metrics for all executors, drivers, and applications across all applications and Spark instance groups. It collects allocated slots as they change, and collects memory and cores every 30 seconds:
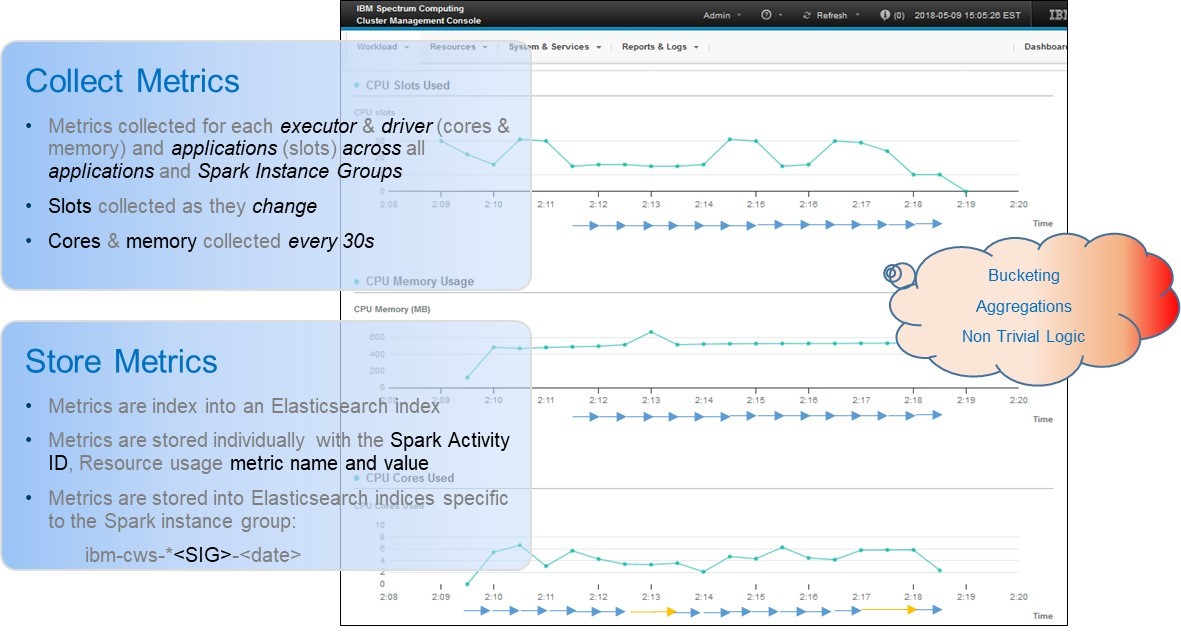
Each metric and metric name combination is indexed as key-value pairs into Elasticsearch, along with metadata to correlate the activity back to the corresponding Spark activity and application. These metrics are stored into distinct indices, directly correlated to their corresponding Spark instance group. The metrics are organized in this way to reduce the amount of disk space required to store the metrics and to optimally perform queries and aggregations.
When IBM Spectrum Conductor generates visualizations that aggregate activity metrics for one application or Spark instance group, this translates to Elasticsearch queries involving bucketing, aggregations, and non-trivial logic, to rebuild data not frequently collected.
Data loader for Spark resource usage aggregation
IBM Spectrum Conductor 2.3 introduces Explorer reports and a new Spark resource usage aggregation data loader (called sparkresusageaggloader). This data loader aggregates or “rolls up” Spark resource usage metrics, including allocated slots, cores, and memory, for both CPUs and GPUs for each application for a one hour duration. The cluster management console within IBM Spectrum Conductor uses the data from the sparkresusageaggloader data loader; IBM Spectrum Conductor additionally aggregates Elasticsearch data to make it consumable to be used for the Spark Charge Back chart.
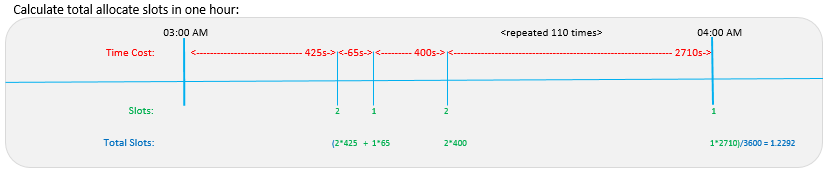
Here are example formulas used to total allocated slots usage for one hour for a single application:
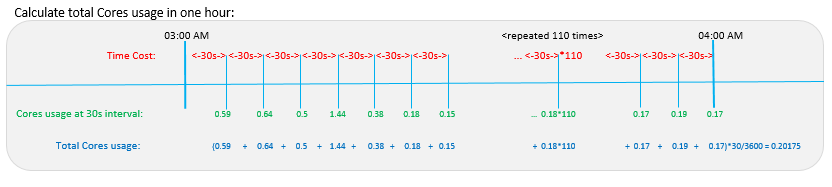
This is an example formula used to total core usage for one hour for a single activity, totaled across all activities for one application:
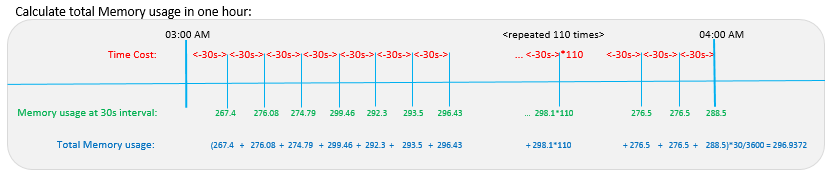
This is a example formula used to total memory usage for one hour for a single activity, totaled across all activities for one application:
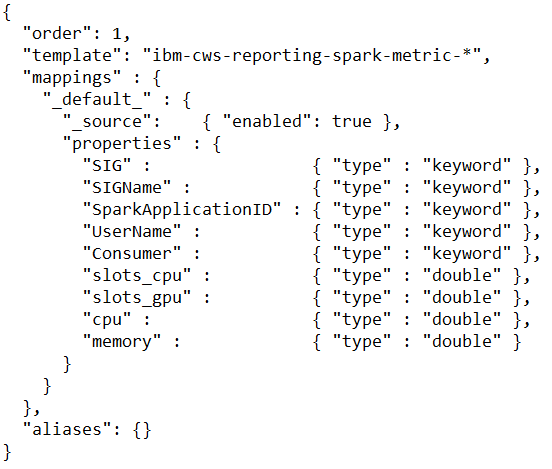
Elasticsearch index template
The aggregated metrics are stored into a new Elasticsearch index for all Spark instance groups. This index in turn can be used to create Spark Charge Back charts, with little to no additional effort.
Each record stores the Spark instance group, user name, and top consumer data, which in turn can be used as filters or to further aggregate metrics. Here is an example of the ibm-cws-reporting-spark-metric Elasticsearch index template, with Spark instance group (SIG), user name (UserName), and top consumer (Consumer) information:
Explorer report charts
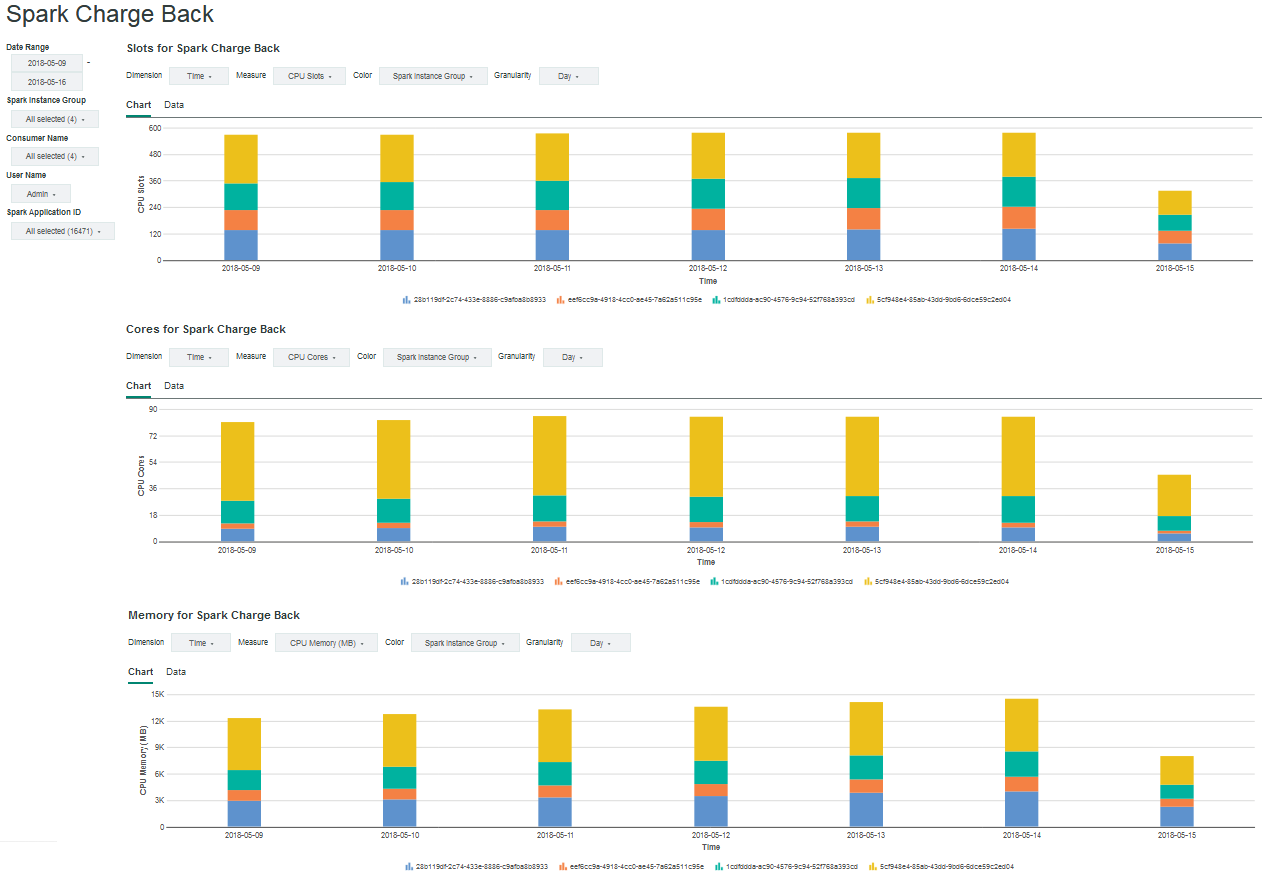
You can view the allocated slots, cores, and memory data that the sparkresusageaggloader data loader aggregates. IBM Spectrum Conductor 2.3 is preloaded with three Spark Charge Back charts: one each for allocated slots, cores, and memory:
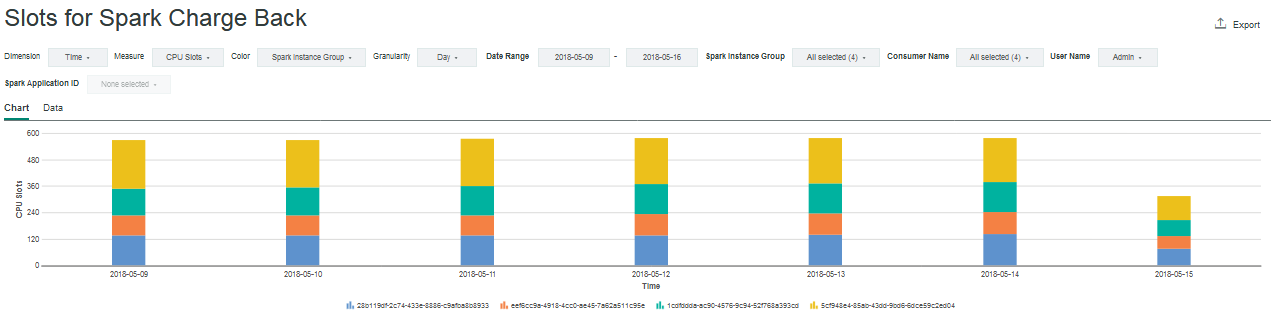
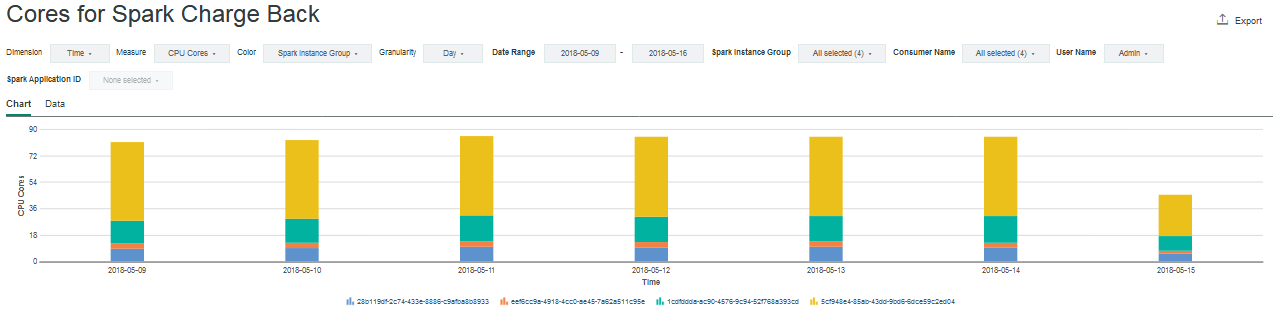
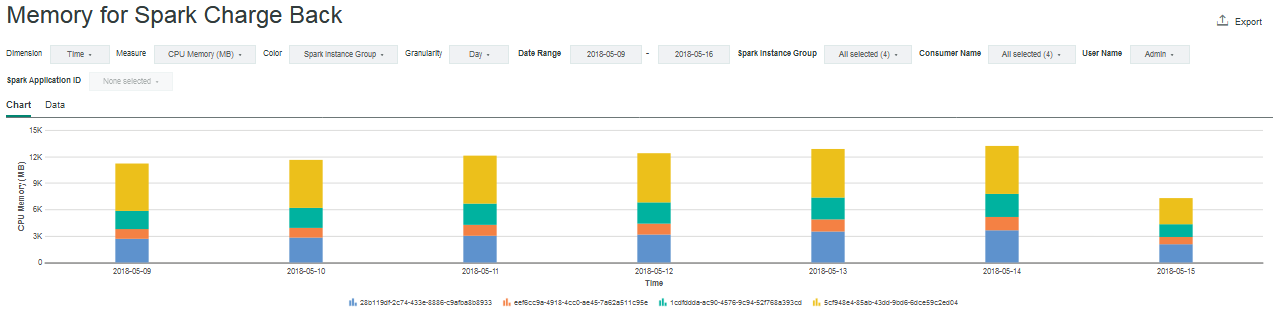
By default, the horizontal dimension shows the time (day), and the vertical or color dimension is the Spark instance group. You can modify both dimensions to partition the data by time, Spark instance group, consumer name, or user name. Use the drop-down list to switch between CPU or GPU metrics. Use the additional drop-down lists to filter data by selecting one or more Spark instance groups, consumer names, or user names.
Explorer reports dashboard
IBM Spectrum Conductor 2.3 is also preloaded with an Explorer reports dashboard that contains all three Spark Charge Back charts.
For the dashboard, the filters are situated to the left, and apply to all charts. The drop-down lists to switch between CPU or GPU metrics, and to filter data, remain above each chart; they apply only to the chart below and do not affect the remaining charts.
Installation and configuration
When you install IBM Spectrum Conductor 2.3, Explorer reports and the Spark resource usage aggregation data loader (sparkresusageaggloader) are included, but initially disabled.
Before enabling the Spark resource usage aggregation data loader, it is worthwhile to explore the data loader’s configuration file and modify where required; otherwise, the defaults will be used.
Metrics that will be aggregated are identified in the aggMetric and aggIntervalMetric properties. The aggBucket and aggIntervalFunction are properties that allow users to tweak the formula used to calculate the memory or core usage for one hour.
You can get full instructions to enable the Explorer reports and its data loader from IBM Knowledge Center.
Learn more!
Now that you have a better understanding of Explorer reports, the Spark resource usage aggregation data loader, and how to explore aggregations of these metrics with out-of-the box visualizations, check out the final blog in this series: Part 3: Leveraging Kibana to create custom visualizations, to use Kibana Timelion visualizations.
#SpectrumComputingGroup