Beyond the View: Exploring the features of the IBM Storage Insights Multi-tenant Dashboard
Overview
Web URL : https://multi-tenant.insights.ibm.com
If you’re new to the concept of IBM Storage Insights Multi-tenant dashboard, our first blog — "One View to Rule Them All" — walks you through what is multi-tenant dashboard is and why it matters. It also explains adding tenants to dashboard and tenant data retrieval strategy. In this follow-up, we’ll explore the key features that make this unified dashboard powerful and practical.
Dashboard Overview
Adding a tenant in multi-tenant dashboard is a two-step process
From Storage Insights User Management, select the user and generate the API key. (This step requires admin access)
Then, click "Add Tenant" in the Multi-tenant Dashboard and provide the tenant ID, the generated API key, and a name to help you identify the tenant.
Once one or more tenants are added, the dashboard automatically loads and displays all tenants along with their associated metrics. The data is presented in the form of summary cards at a multi-tenant level, providing a consolidated view.
The left navigation panel lists all added tenants and indicates their connectivity status using intuitive icons. Selecting a specific tenant from this panel filters the displayed metrics to reflect only that tenant's data. The cards on the dashboards show key metrics aggregated across all tenants by default. These cards provide actionable insights and serve as a quick summary of system-wide performance.
Below is a detailed explanation of each card displayed on the dashboard.
|
|
Tenants
This section displays the total number of tenants added and their current connectivity status. Clicking the "View All Tenants" button navigates to the Tenants page, which lists key information such as tenant name, ID, connection status, and more.
|
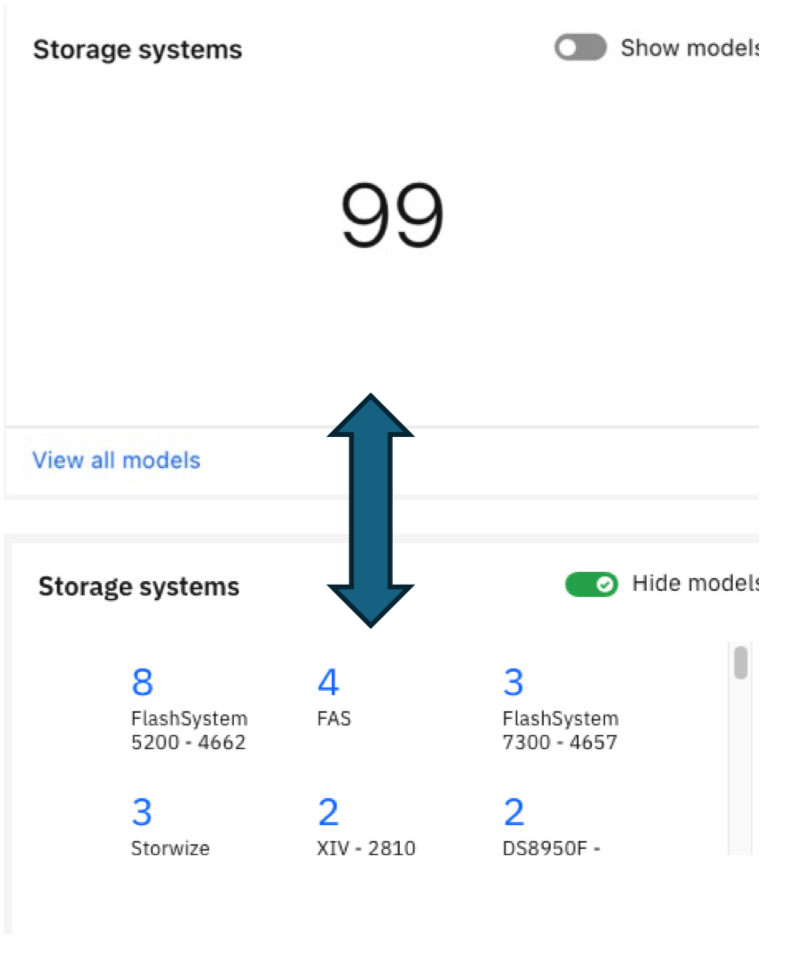
Storage systems
The section displays the total number of storage systems associated with all added tenants along with option to view broken counts. The "View All Models" button navigates to the Storage Systems page, which presents a table of all storage systems
|
 |
|
|
Capacity
This card highlights total, used, and available capacity, offering a quick visual summary of storage utilization. The total physical capacity is prominently shown at the top right, and updates dynamically based on tenant selection.
|
Warranty
The Warranty section shows the number of systems with expired warranties or those expiring within 3, 6, or 12 months. Clicking on "View All" navigates to the Maintenance Information page, which displays warranty data for all systems in a table. If a tenant is selected from the dashboard, the table is filtered accordingly.
|
|
|
|
Alerts
The Alerts section provides a summary of active alerts categorized by severity—Critical, Warning, and Info, each marked with a distinct icon for immediate visual recognition. Clicking on "View All " navigates to the Alerts Details.
|
Capacity insights
The Capacity Insights section highlights the number of systems projected to reach critical capacity thresholds within the next 30, 60, or 180 days, using AI-based capacity forecasting derived from alert data. Clicking the "View All" button redirects users to the Alerts details with capacity-related alerts nearing threshold limits.
|
|
|
|
Drives
The Drives view displays the total number of drives across for all tenants, dynamically updating to reflect the count specific to a selected tenant from. Clicking the "View All drives" navigates to the Drives details, which presents a detailed information of all drives. A global filter allows users to quickly identify drives with compression enabled or disabled, offering clear visibility into storage optimization across systems.
|
Advisories
This view displays two metrics: the number of Call Home advisories and Health Checker advisories, helping users quickly assess potential issues across tenants. Clicking the "View details" opens the Advisories page, where each detail includes recommended actions that guide business partners in addressing underlying problems with details such as severity, time of occurrence & the device involved.
|
|
|
|
Notifications
This view displays the total count of Call Home notifications triggered by cloud service events from storage systems associated with added tenants. Clicking the "View details" button takes users to the Notifications page, where each notification detail includes details such as severity, time of occurrence, and the device involved.
|
Additional salient features.
The multi-tenant dashboard allows users to view detailed information for each component in an easy-to-read table format, with built-in options to filter, sort, and organize the data. It also supports exporting the table content as a CSV file for offline access and reporting.
Users also have the ability to directly open the selected resource in the tenant’s Storage Insights view and set reminders for specific tenants or resources, helping ensure timely follow-ups and actions.
Summary
The IBM Storage Insights Multi-tenant Dashboard offers a powerful and easy-to-use way to monitor and manage multiple tenants in one place. It gives a clear overview of key metrics like connected tenants, storage systems, capacity usage, warranty status, active alerts, and upcoming risks—presented through intuitive visuals and summaries. Each section of the dashboard helps users quickly identify what’s working well and what needs attention.
With just a click, you can dive deeper into detailed views that include all relevant information in organized tables. These tables let you search, sort, filter, and even download data for reports. Helpful actions like setting reminders for follow-ups or jumping directly to a tenant’s view are also included, making it easier to stay on top of operations and respond proactively to issues.
Feedback
You can provide your feedback using the Send feedback button on bottom of the page.
OR
Contact IBM support: IBM Support
Additionally feel free to reach on email to prabira.acharya@ibm.com OR sushil.sharma@in.ibm.com
Documentation link : Multi-tenant dashboard documentation
NOTE: If you're not familiar with IBM Storage Insights, this guide is a great place to start for your initial exploration.