App TCO Case Study
Beginning October 2020, we embarked on a significant AppTCO model upgrade to bring accountability, actionability and insights to Application TCO reporting.
The initial implementation delivered the ability to see costs allocate through the model using “good” allocation strategies, referencing Apptio’s Good/Better/Best philosophy, but the reporting and dilution of cost clarity through these allocations created skepticism for App Owners, slowing adoption.
These initial reports provided an informative view from a C-Suite level, but the Application Owners wanted to see the granular details behind the numbers before buying into the accuracy of the data. As such, most application reviews were spent defending the numbers and digging into TBM Studio to see what was making up the cost of each Tower/Cost Pool being attributed to the Application instead of focusing on insights and meaningful action.

Figure 1 (OOTB Reference Report displays monthly and YTD spend for a specific application)

Figure 2 (OOTB Reference Report displays IT Tower Spend for a specific application with no additional details)
The rebuild goal was to improve these “Good” allocations with granular details that would support more accuracy and clarity higher up in the model, allowing App Owners to investigate and validate costs using a self-service approach. This was achievable with a simplified cost composition and a new collection of Application reports.
Collectively the TBM Team agreed to group application costs by these 8 cost drivers and identified the source of data for each. These cost drivers are familiar to application owners and are easily validated through other systems.

Figure 3 (Displays the application name, monthly cost and the amount contributed from each of the 8 drivers)
Once a strategy was in place to achieve Application Owner buy-in, we Defined each Use Case that the AppTCO needed to support:
- Increased adoption through application rationalization.
- Reduced cost for licensing, maintenance, and support through vendor & contract visibility.
- Improved consumption of license counts, infrastructure resources through support tickets analysis
- Identify and Quantify the amount of Application spend outside of DT (Digital Technology)
Supporting this new vision required a re-architecture that would allow us to move from assumptive to consumptive allocations, as well as the reimagined cost composition of applications that was presented to App Owners.
This new approach required considerable participation from Finance leaders and other SME’s (Subject Matter Experts), and new integrations with ServiceNow. As the Principal Consultant, I led design strategy and performed all the model architecture/configuration changes and built the new collection of Application reports.
The success of this endeavor is credited to the strength of the team and the sponsorship from Senior Leadership and their desire to make this successful by prioritizing this effort.

The final result is an AppTCO that is understandable and defensible.
App owners have begun assisting with the creation of action plans and insights for their applications, focusing more on increased adoption, cost cutting opportunities, and better consumption vs data collection & validation.
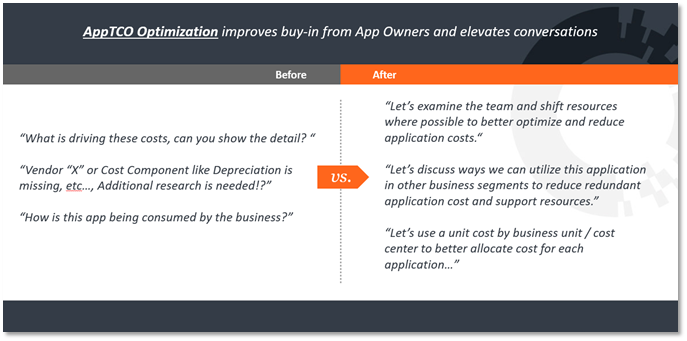
Most App Owners know the major cost drivers of their application, so providing them a TCO that does not clearly display those details creates skepticism; as such, most conversations with owners will revolve around defending and/or explaining the numbers.
When the costs are presented in a way that includes the numbers/drivers they are familiar with, and can be validated, conversations are completely different, and focused on optimization, efficiency, and insights.
For any company looking to improve the usefulness of Application TCO, and report on their application spend, I hope this story resonates with you!
ETBMA_Case_Study_PPT_App_TCO_Joshua_Roberto.pdf
#CostingStandard(CT-Foundation)