Spot Garbage Collection Overhead in BAW on container
While IBM Business Automation Workflow (BAW) has evolved to run on the WebSphere Liberty profile in a container-based environment, many JVM monitoring and analysis tools from the past are still available and useful in a container world.
One example of this is a method to gain insights into the heap utilization of the Java Virtual Machine (JVM) by enabling verbose garbage collection.
When you install BAW on containers, you will use a Custom Resource (CR) template to define CPU and memory limits for each component. Or, in case no limits are specified, the system defaults will apply (see for example baw_configuration[x].resources.limits.cpu and baw_configuration[x].resources.limits.memory defaults in BAW parameters) Depending on your workload and usage patterns, the default heap setting and memory limit assigned to the BAW container might be insufficient.
In this article, we will show you how to gain insight in to the memory usage of BAW, enable verbose garbage collection (GC), analyse GC logs and adjust heap setting and memory limits if necessary.
(Examples below are showing BAW 20.0.0.2 on container as part of an IBM CloudPak for Automation 20.0.3 installation running on OpenShift 4.6. UIs and syntax might change in future versions. The ICP4ACluster name in the examples is "demo", please adjust accordingly if your cluster name is different.)
1. Observe memory and CPU usage using OpenShift Web Console
A quick overview of the memory used by BAW pods can be gained using the OpenShift Web Console.
Note that the console displays the memory usage of the entire pod, not just the JVM. However, since the JVM is the only major consumer of resources inside the pod, this gives a good approximation of JVM memory consumption over time:
 1.
1.
- Select Workloads -> Pods and filter for "baw-server"
- Click any baw-server pod to get a basic memory and CPU usage diagram (as seen above)
- Click on the "Memory Usage" diagram to get to the Metrics UI which will allow a more detailed analysis of memory usage and CPU load over time.
If you find that CPU and memory usage is unexpectedly high under load, a possible issue might be insufficient heap size, resulting in garbage collection overhead in the JVM.
2. Analyse heap utilization
In order to gain some insights into the heap utilization in high load situations, you should enable verbose garbage collection and then perform a load test.
Enable verbose garbage collection
- Edit your custom resource YAML or modify the running ICP4ACluster directly using the OpenShift CLI tool:
oc edit icp4aclusters.icp4a.ibm.com demo
- Find or create the baw_configuration[x].jvm_customize_options key and add the following custom JVM options:
jvm_customize_options: -verbose:gc -Xverbosegclog:dump/verbosegc.log,10,10000
The -Xverbosegclog parameter will output the garbage collection logs to a file, making it easier to use it in analysis tools (see below).
The numerical options make sure that log files roll over.
Note: This will place the log files inside the "dump" volume and not the "logs" volume, otherwise the output of the verbose garbage collection would clutter up the pod log stream.
- Finish editing and wait for the cp4a-operator to apply these changes. The added JVM options will appear in the
*-baw-server-configmap-liberty config map under jvm.options.
You can use this command to await completion:
watch -g "oc get configmap demo-instance1-baw-server-configmap-liberty -o yaml | grep verbose"
- Because jvm.options in Liberty are only sourced during the start script, you need to "restart" the BAW server by deleting the pod:
oc delete pod demo-instance1-baw-server-0
- It is recommended to leave verbose garbage collection enabled, as it might provide helpful insights when analyzing performance issues in the future.
Interpret garbage collection logs
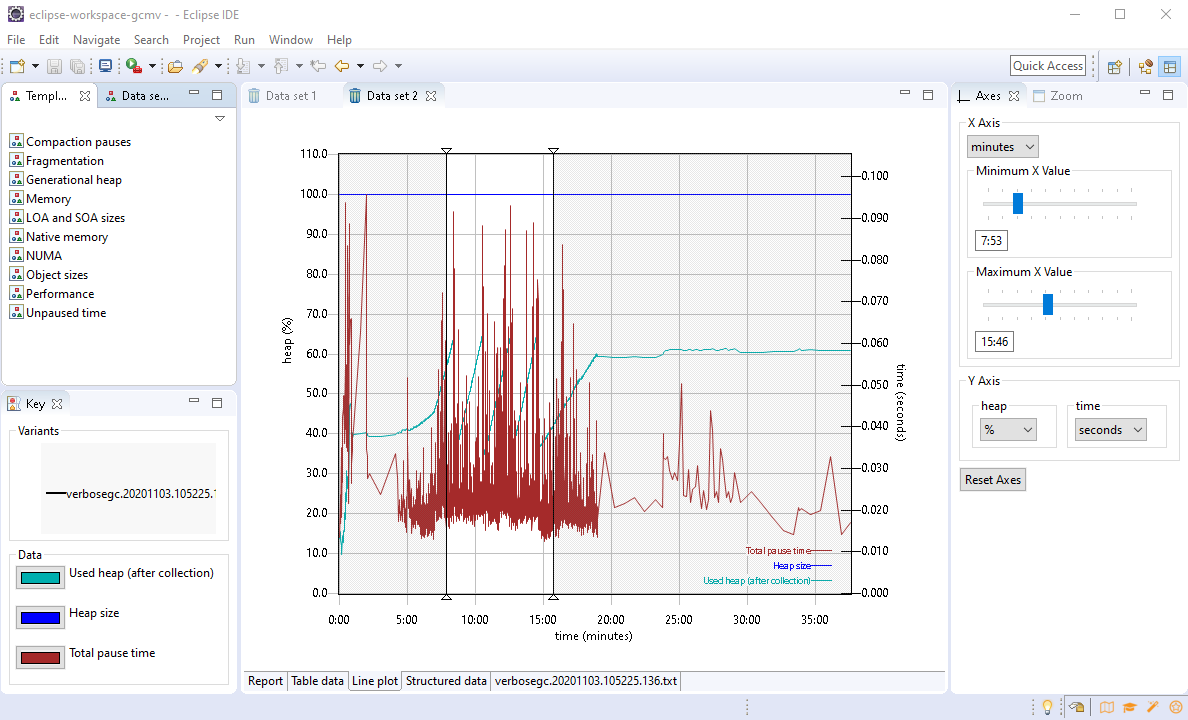
In order to see a graphical representation of the garbage collection logs and helpful tuning recommendations, you can use the Garbage Collection and Memory Visualizer (GCMV) tool:

- Install the GCMV tool as described in the documentation.
- Retrieve the GC log files from your persistent volume (if you used the dump path as shown above, this is should be on the server and path configured in
baw-dumpstore-pv)
- Import the log file (File -> Load...) and constrain the data set to the relevant time period by specifying a Minimum and Maximum X Value in the "Axis" tab. The "Report" tab might now immediately reveal if too much time was spent doing garbage collection:

3. Increase heap size and memory
If your analysis shows that memory is insufficient, you can increase the size of the heap for BAW on container by adding the -Xmx property to the jvm_customize_options in the Common Resource:
jvm_customize_options: -Xmx3G -verbose:gc -Xverbosegclog:dump/verbosegc.log,10,10000
Make sure that you set the available memory limits accordingly to prevent out of memory exceptions.
## Resource configuration
resources:
limits:
## CPU limit for Workflow server.
cpu: 4
## Memory limit for Workflow server
memory: 4Gi
This is the first installment of the BAW Performance and Scalability Series, which will soon continue with more performance related tips and tricks, tuning recommendations and how-tos for BAW on containers.