If you have a Drill report, and you have configured the DrillTo link, in the parent report, to “Include current report’s filters” (see image 01.), you may want to validate the data displayed in the report by comparing it to the data at the Model. Here are the steps to do this:

01. Include current report’s filters
Step 1) From the parent report, select the desired filters
Step 2) Click on the link for the Drill report

02. Parent Report with slicers selected
Step 3) After the child report loads, right click on the table you wish to validate and select “Show Full Data Path..” from the menu

Step 4) The Full Data Path window will appear. It is helpful at times to copy the text from this window and use it in a text editor to reference later.

Here is the Data Path in this example:
georgeland.apptio.com:George Cost Transparency/
Reports/
.DateGoesHere/
CostModels/
Default/
.View:tab:Service Costing/
.View:Cost Transparency Summary - Finance/
IT Resource Towers/
!FILTER[{IT Resource Sub-Tower Name}="App Development"]/
!FILTER[{IT Resource Towers Master Data.IT Resource Tower Name} NOT IN ()]/
.WithDefaultMetric-Cost/
.DrillTo/
Cost Source/
!FILTER[{Cost Source Master Data.Cost Pool} NOT IN ()]/
!FILTER[{Cost Source Master Data.Cost Center + Name} IN ("Compute-Linux (CC1565242359)","Compute-Mainframe (CC1565242342)")]/
!FILTER[{Cost Source to IT Resource Master Data.Cost Center}!="{Various}"]/
.Summary/
!NEWCOLUMN[{Cost Center Full Name}=Cost Source Master Data.Cost Center Name+" ("+Cost Source Master Data.Cost Center+")"]/
!GROUPBY[{Cost Center Full Name}]/
!ALL_ROWS/
!NEWCOLUMN[{Current FY Plan YTD Variance}=Current FY Plan YTD-Cost YTD][=Currency({$_},"#,###")]/
!NEWCOLUMN[{% YTD Budget Variance}=(Current FY Plan YTD-Cost YTD)/Current FY Plan YTD][=NumberFormat($_,"##.#%;(##.#%)")]/
!NEWCOLUMN[{ }=][=NumberFormat({$_},"#,###.00")][label]/
!NEWCOLUMN[{Actuals and Remaining Plan}=YearToDate(Cost)+(Annual(Current FY Plan)-YearToDate(Current FY Plan))][=Currency({$_},"#,###")]/
!NEWCOLUMN[{Annual Current FY Plan}=Annual(Current FY Plan)][=Currency({$_},"#,###")]/
!NEWCOLUMN[{Annual Current FY Plan Variance}=Annual Current FY Plan-Actuals and Remaining Plan][=Currency({$_},"#,###")]/
!SORT[{Cost YTD}|desc]/
!LIMIT[0,2147483647,add_total]/
!LIMIT_COLUMNS[{Cost Center Full Name},{Cost YTD},{Current FY Plan YTD},{Current FY Plan YTD Variance},{% YTD Budget Variance},{ },{Actuals and Remaining Plan},{Annual Current FY Plan},{Annual Current FY Plan Variance}][][][orderByIncludeList]/
Step 5) Observe the filters in the Data Path that are listed before the “.DrillTo”
a) In this example, we have “IT Resource Towers” as the object that the filters are being applied to
b) The filters for the IT Resource Towers object in this example are:
i) IT Resource Sub-Tower Name = “App Development”
Step 6) Navigate to the Model tab and select the model that the objects you are reporting on
a) In this example it is the Cost model
Step 7) Add the filters, that are before the Drill, to the Summary Data for the object
a) Select the object before the Drill (IT Resource Towers in this case)
b) Right click on the Summary Data table and select “Show/Hide Columns…”

c) Add the column to be filtered (In this case it is “IT Resource Sub-Tower Name”

d) Now filter in the column for the data specified in the Data Path (in this case it is “App Development”)
Step 8) Add the filters after the Drill
a) Right click on the data in the Object Identifier column for the object in the Summary Data table (still IT Resource Towers in this case) and select “Trace…” (it will show whatever data is listed).
NOTE: Running a trace can sometimes be memory expensive, thus, it is best to be aware if there are multiple users in the instance at the time. The trace should never be done in the production instance.
b) After the trace completes, select the object being drilled to (in this case it is the “Cost Source” object) and use the same process in Step 7 to add the columns, listed after the “.DrillTo” in the Data Path, to the Summary Data table.
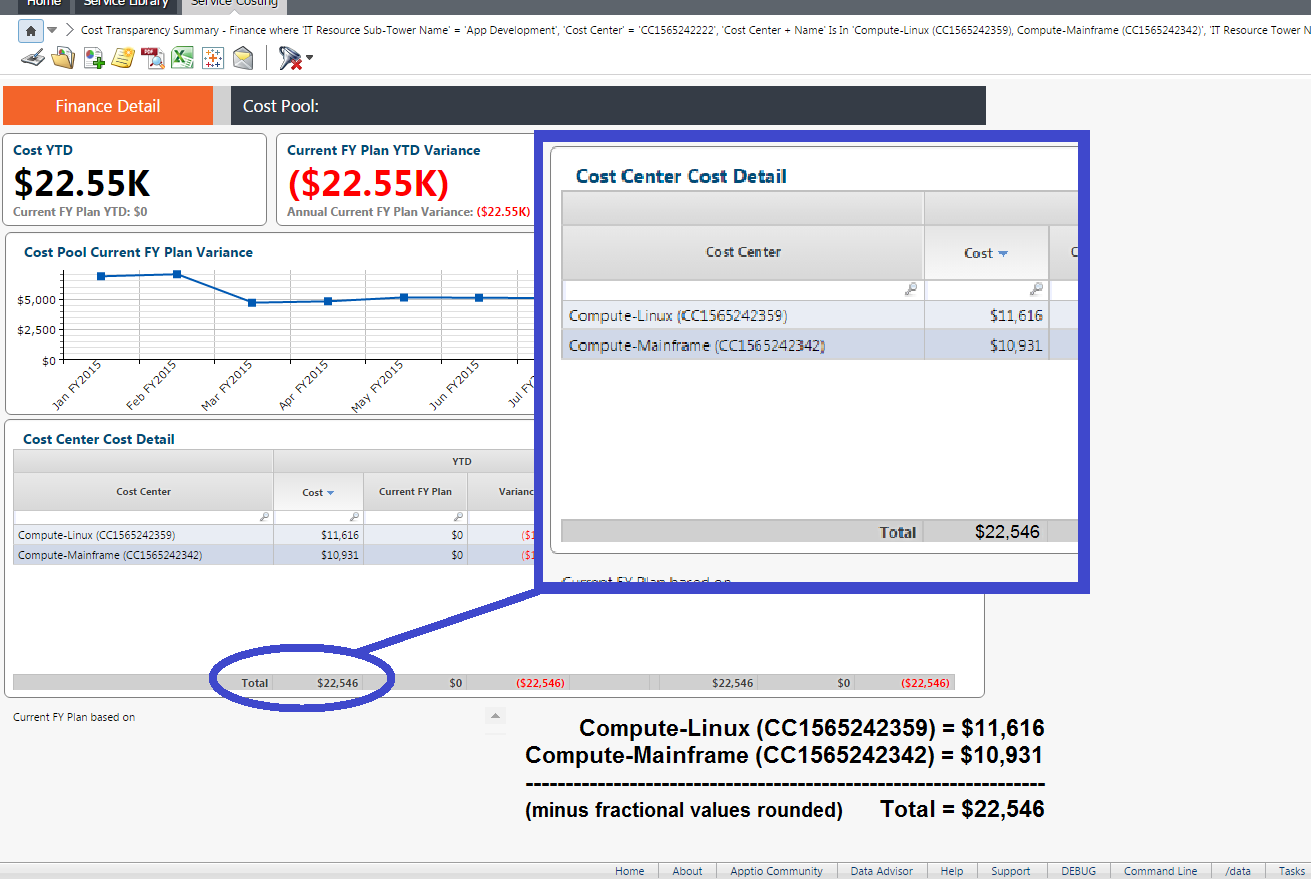
c) Filter the columns using the data in the Data Path (in this example we are filtering the “Cost Center + Nam” column on the follow two values:
Compute-Mainframe (CC1565242342)
Compute-Linux (CC1565242359)
d) Since the report is showing Cost YTD we have added “Cost YTD” column to validate against.

e) We filtered on each of the Cost Center + Name values separately and added the Cost YTD from each result.

Step 9) Compare the totals to the to the total in the report (in this example it is the “Cost” column in the YTD group of the “Cost Center Cost Detail” table)
Remember: Ensure that you are validating the data on the reporting surface in the same time period that you are viewing the Model in.