It has been a tough week, along with all the projects I'm working, we had problems with our demo system (used by over a 1000 people). One of my responsibilities is to manage the SevOne demo platform in IBM cloud and during the last seven days the system was going on and off all the time. After a lot of time spent on this issue, and with help from the security team we realised that we were being targeted with a DDoS attack!

Platform Availability
What do we do now?
Thanks to our security team, we applied some best practices that we were missing, but I'm no expert in security and I'm still not sure whether these measures will stop the problems or not... As said, I'm no security expert, but I'm a monitoring expert (or at least I think I am :) ) and what I do know very well is how to make sure this does not happen again.
Based on my experience, the first thing I wanted to do is to enable NetFlow in order to analyse the traffic and see what is hitting our demo platform, but unfortunately it looks like we don't have that functionality in our systems.
If I can't monitor the type of traffic, let's monitor at least the connections in our server. Therefore first thing I checked is if we are monitoring the TCP connections and unfortunately this is not something that we get using our standard SNMP polls. How can I get that data? I check online and there are some netstat commands that can give me the current number of established connections, close wait, foreign, lask ack, syn sent, syn received... That's what I need! But how can I monitor CLI commands data? Very easy, I use IBM Rapid Network Automation to build a workflow in 5 minutes that will collect that data and ingest it into our monitoring system.

RNA workflow to collect connections data
This is great because now I can collect connections information and, even more important, analyse the data. I always mention the same story from when I was working as a network engineer: every time I opened a ticket with a vendor regarding some malfunction on a network device, they said 'apply this change and compare performance with baseline'.
How can I get the baseline?
With IBM SevOne NPM and its ability to collect all network data, and to analyse the data, I managed to calculate the baseline of all the KPIs monitored (including the connections from my demo system) but also use other analytics that applied very well for my troubleshooting scenario. In this case I used the 'time-over-time' functionality that allows me to display the current performance of any metric with the average performance for the last minute, hour, day... In this situation I wanted to compare today with yesterday to see how the changes applied from the security team impacted our system.

Time over time comparison
In this graph, the solid line represents the actual metrics that we want to display, and the dotted line is the value of those metrics yesterday. It's clear that the changes made by the security team had a massive impact on our server. Finally my mind is (almost) at ease.
What's next?
I'm still worried, what if this is not enough, what if these changes don't stop all the DDoS attacks? If this happens again, it'd be great to get a copy of the actual traffic received, to see precisely what's going on in my server, but how can I do that?
Firstly, with SevOne we don't only monitor and analyse the data, we can also generate alerts when an anomaly occurs on my network. Therefore I created a new policy that triggers a notification when an anomaly occurs on any of the connection types that we are monitoring.
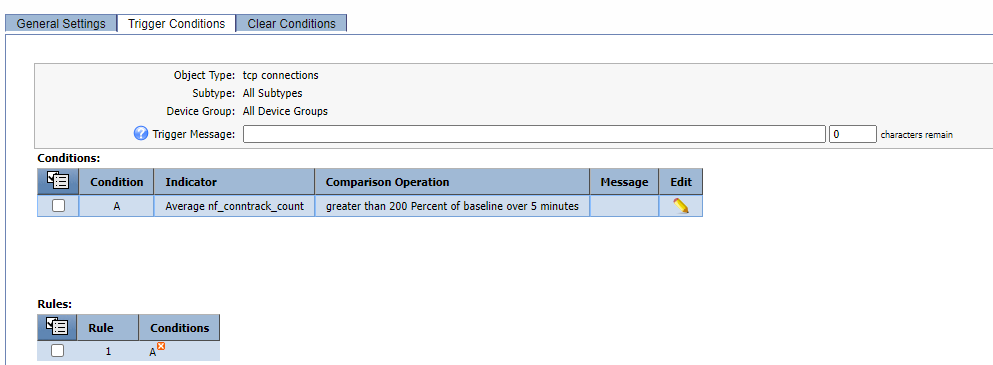
Anomaly Detection Alert
What do we do with this alert?
The notification generated from the triggered alert will be sent to RNA to trigger another workflow that will connect to our server, perform a packet capture during 60 seconds, and send the .pcap file to an external server in order to have some evidence that we would be able to review after (or during) the attack.

RNA Workflow for packet capture
Finally I'm sure that if this issue occurs again, I'll have all the info I need to make sure it won't happen again.

Tcpdump results