Can SevOne NPM monitor Linux?
Yes.
It may be a server or a virtual machine or network function but at the end of the day if its running Linux you can likely and very easily get performance metrics collected to help you manage and observe it with SevOne NPM. This would include interface stats, compute, memory, disk and storage related information. Additionally SevOne NPM will be able to grab metadata and draw topology.
Being able to correlate and analyze these different stats together in a single spot in SevOne NPM is helpful in understanding if the network is causing issues to or suffering problems caused by compute, memory or disks on the server. It helps put infrastructure teams on the same page and in the same report; troubleshooting with the same source of truth via SevOne NPM. As more networking products emerge that are based on Linux, it's important that your network observability product can support them.
Who can we thank? The Net-SNMP package on Linux. Simply install the package (if doesn't already exist) in the /etc directory on the server and configure it accordingly to respond to SNMP requests from SevOne NPM and you'll enjoy the default capability you get with any metric collected via SevOne NPM such as grouping, historical views, data modeling, analytics, thresholding and reporting/visualization.
Check out the Linux Device Summary template below that's part of SevOne NPM today and see how it can help observe and understand network performance on your Linux based devices.
Linux Network / System performance monitoring
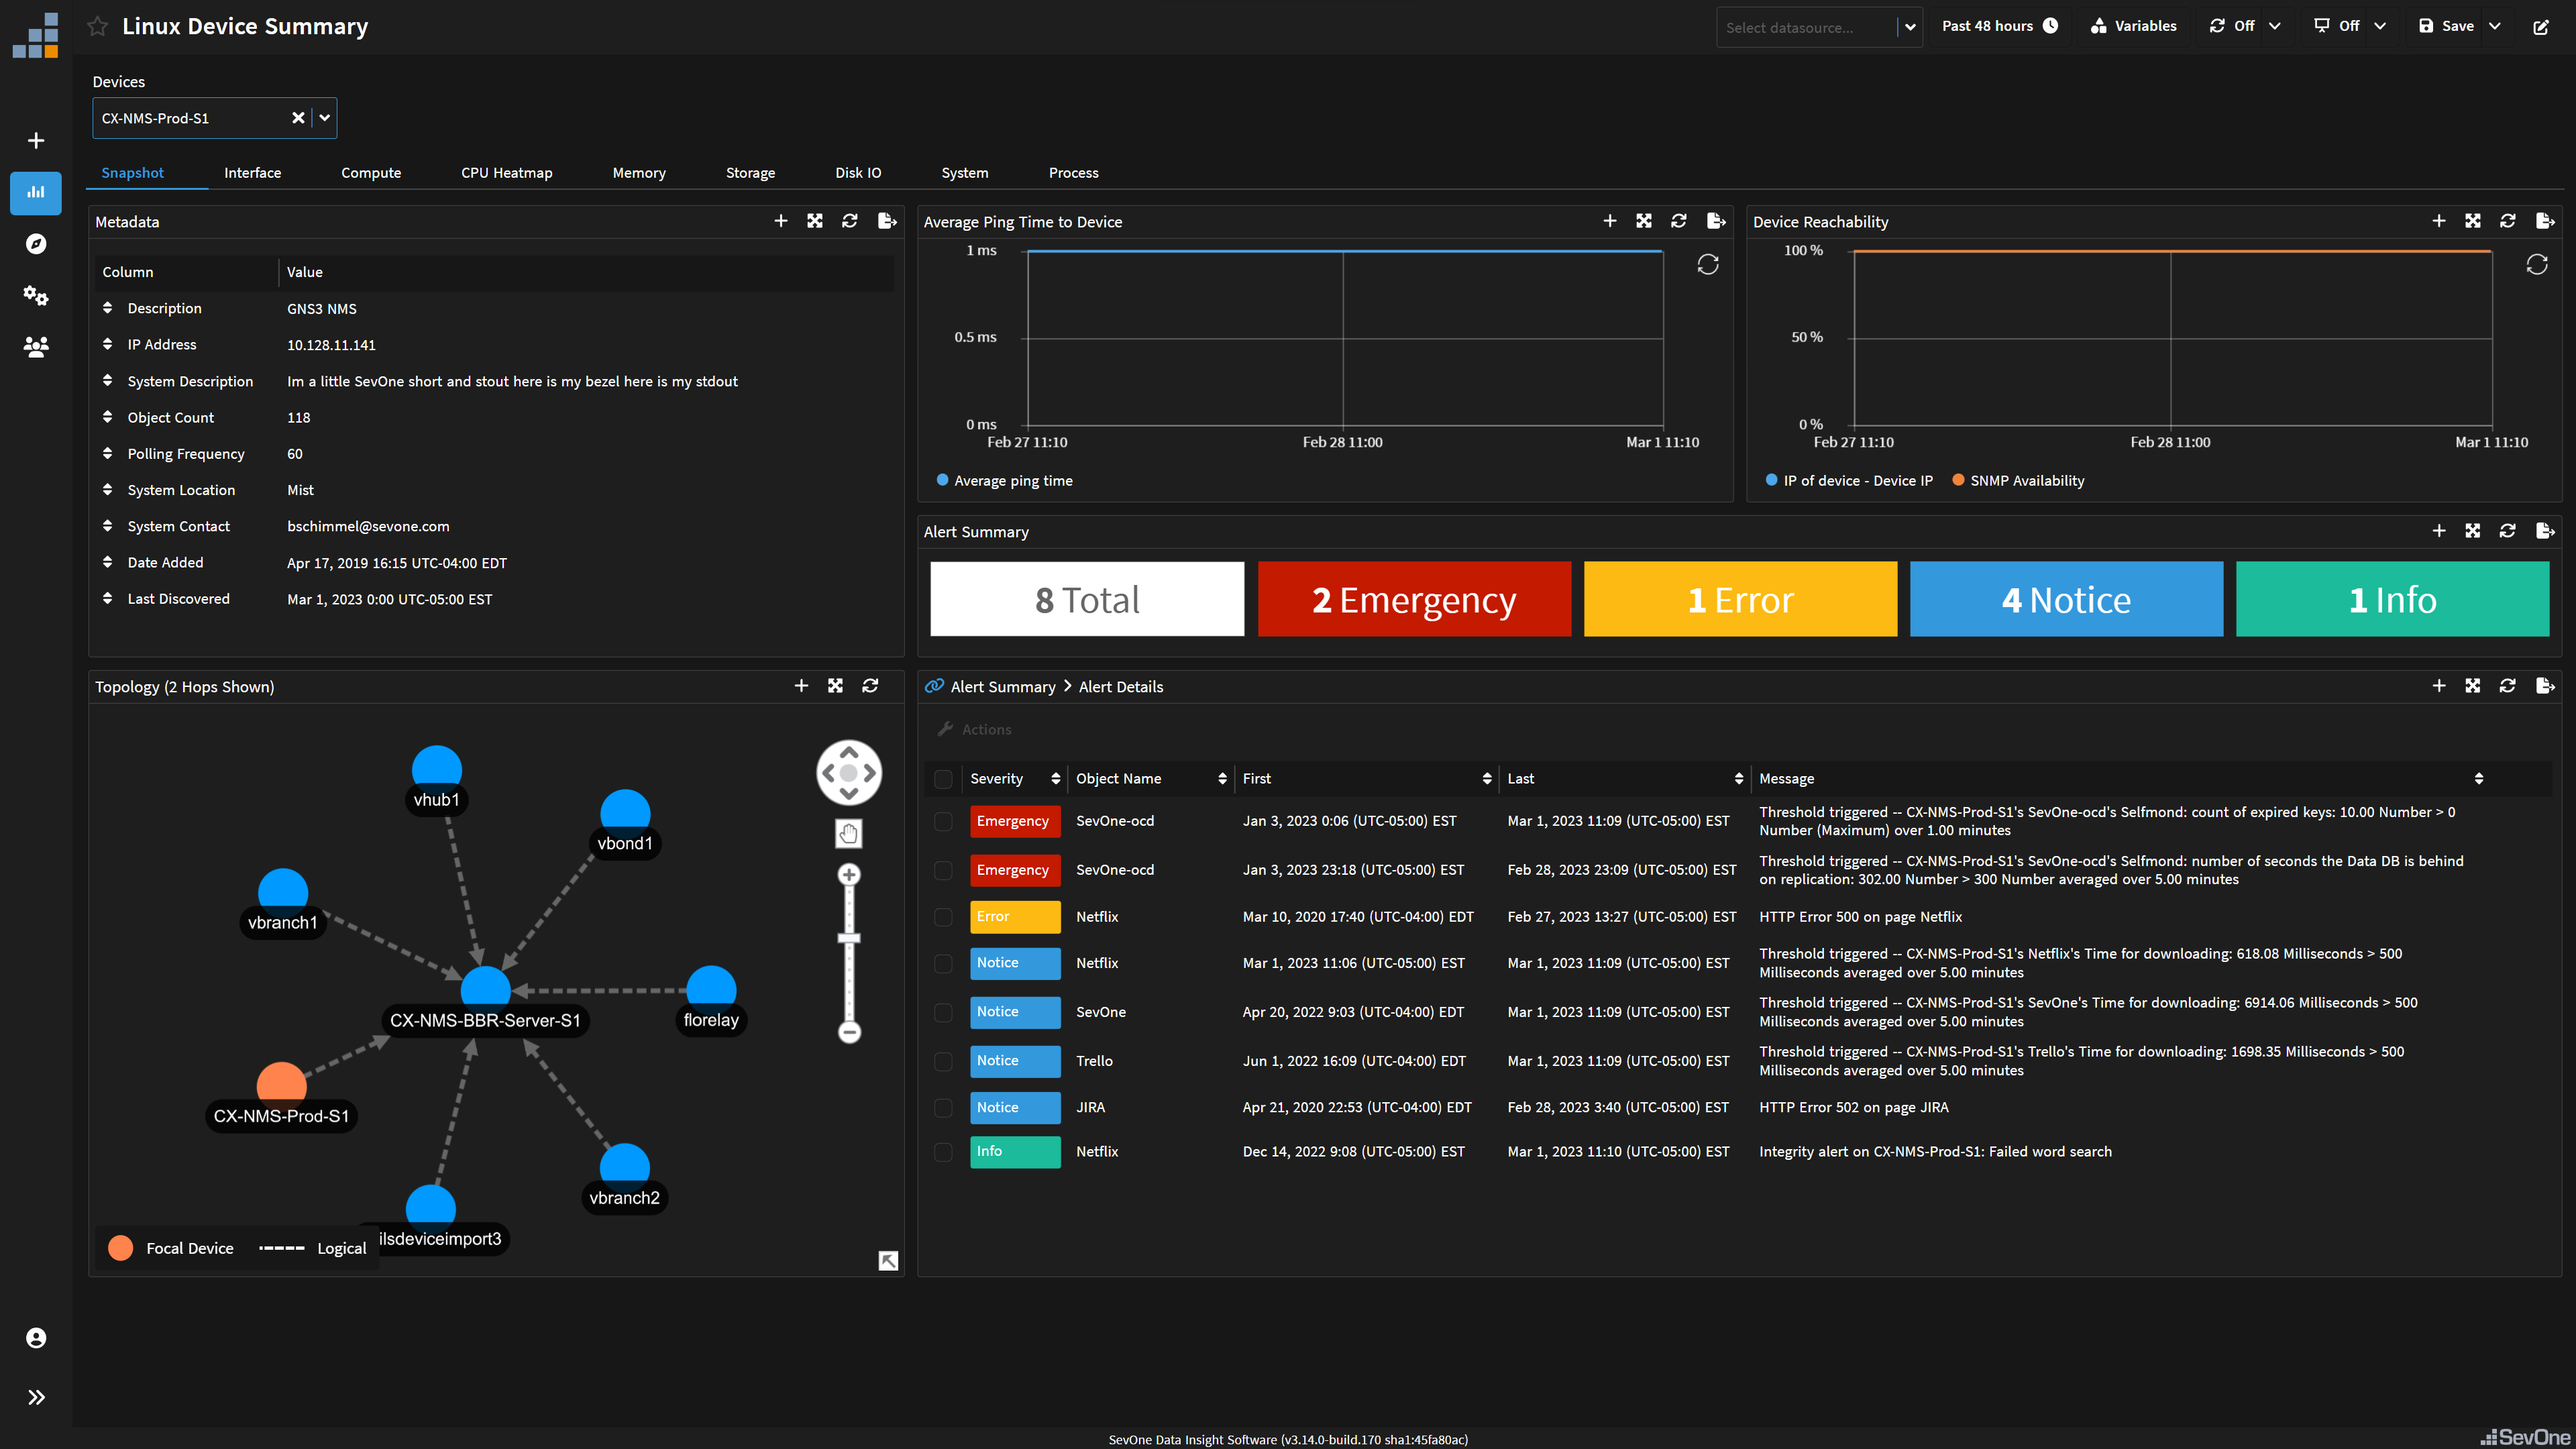
Snapshot
The summary tab is designed to show overall system status information. Are there any active alerts? How is it connected to other devices? Who owns it? Where is it? Can I reach it?
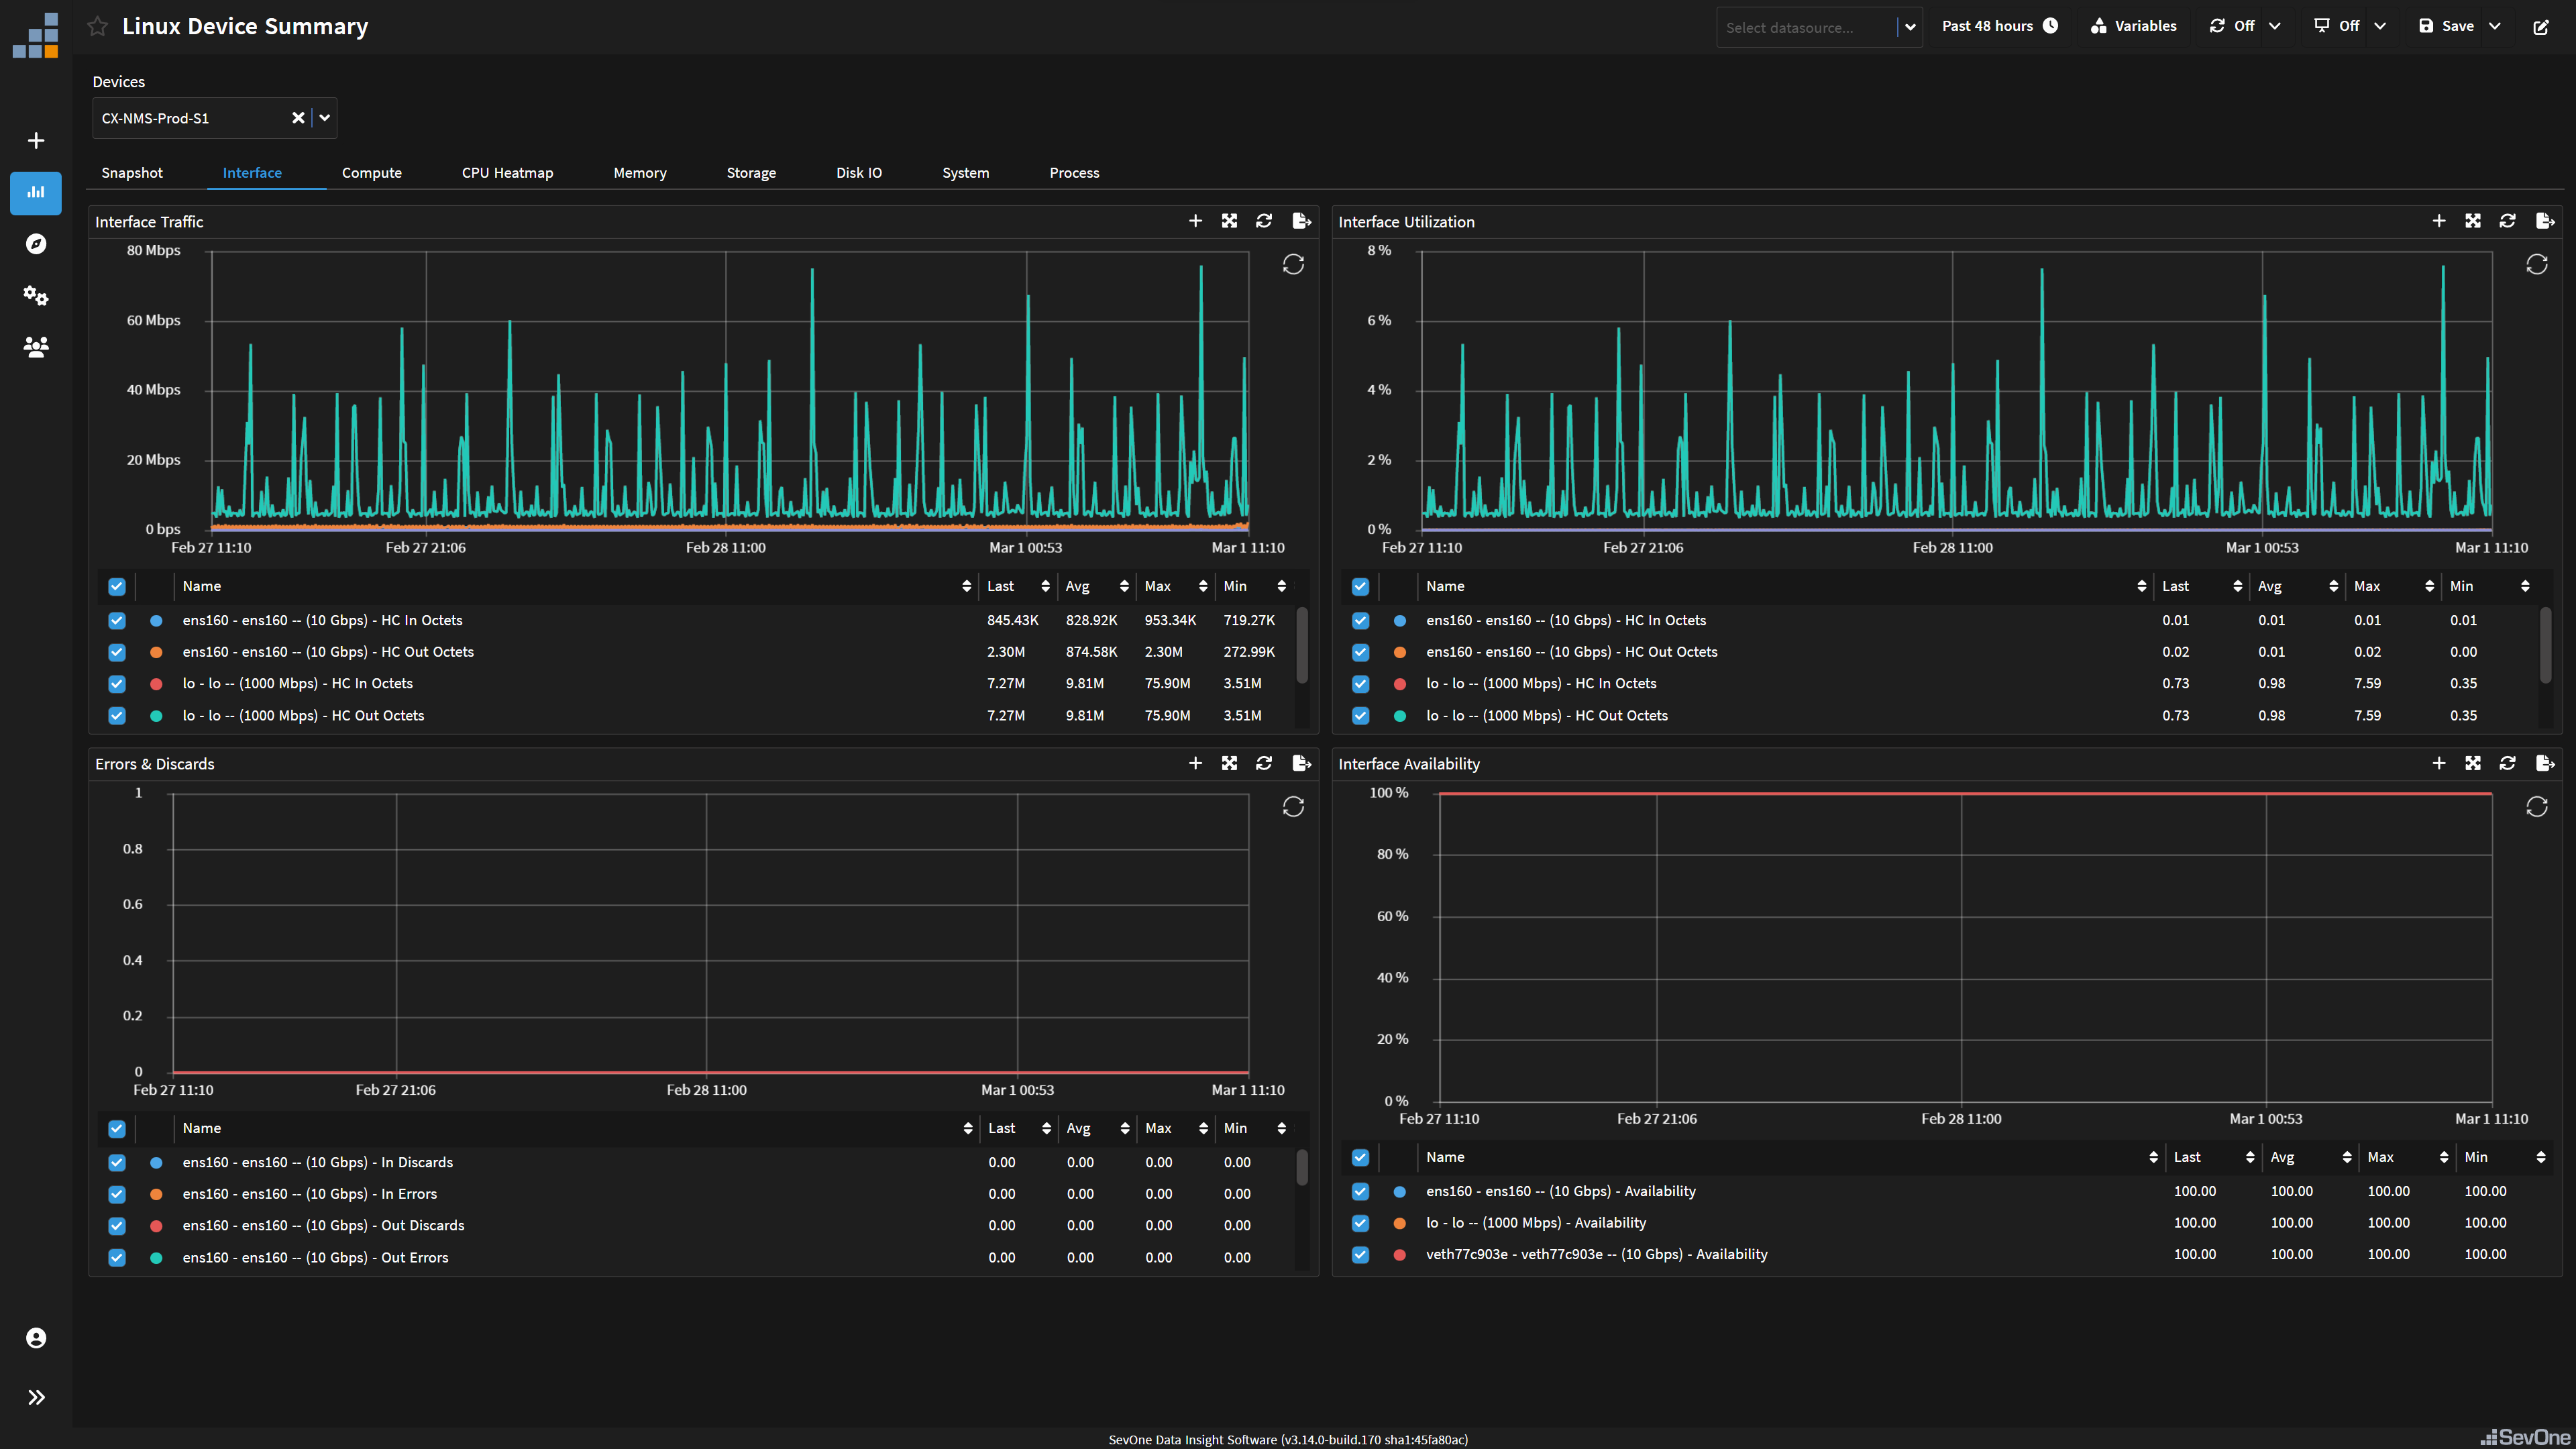
Interface
The interface tab is what every network engineer needs to know. See the volume of traffic coming in and out of the interfaces plus the utilization of them relative to their capacity limit. It also provides availability and key stats like errors to discards to aid in troubleshooting.
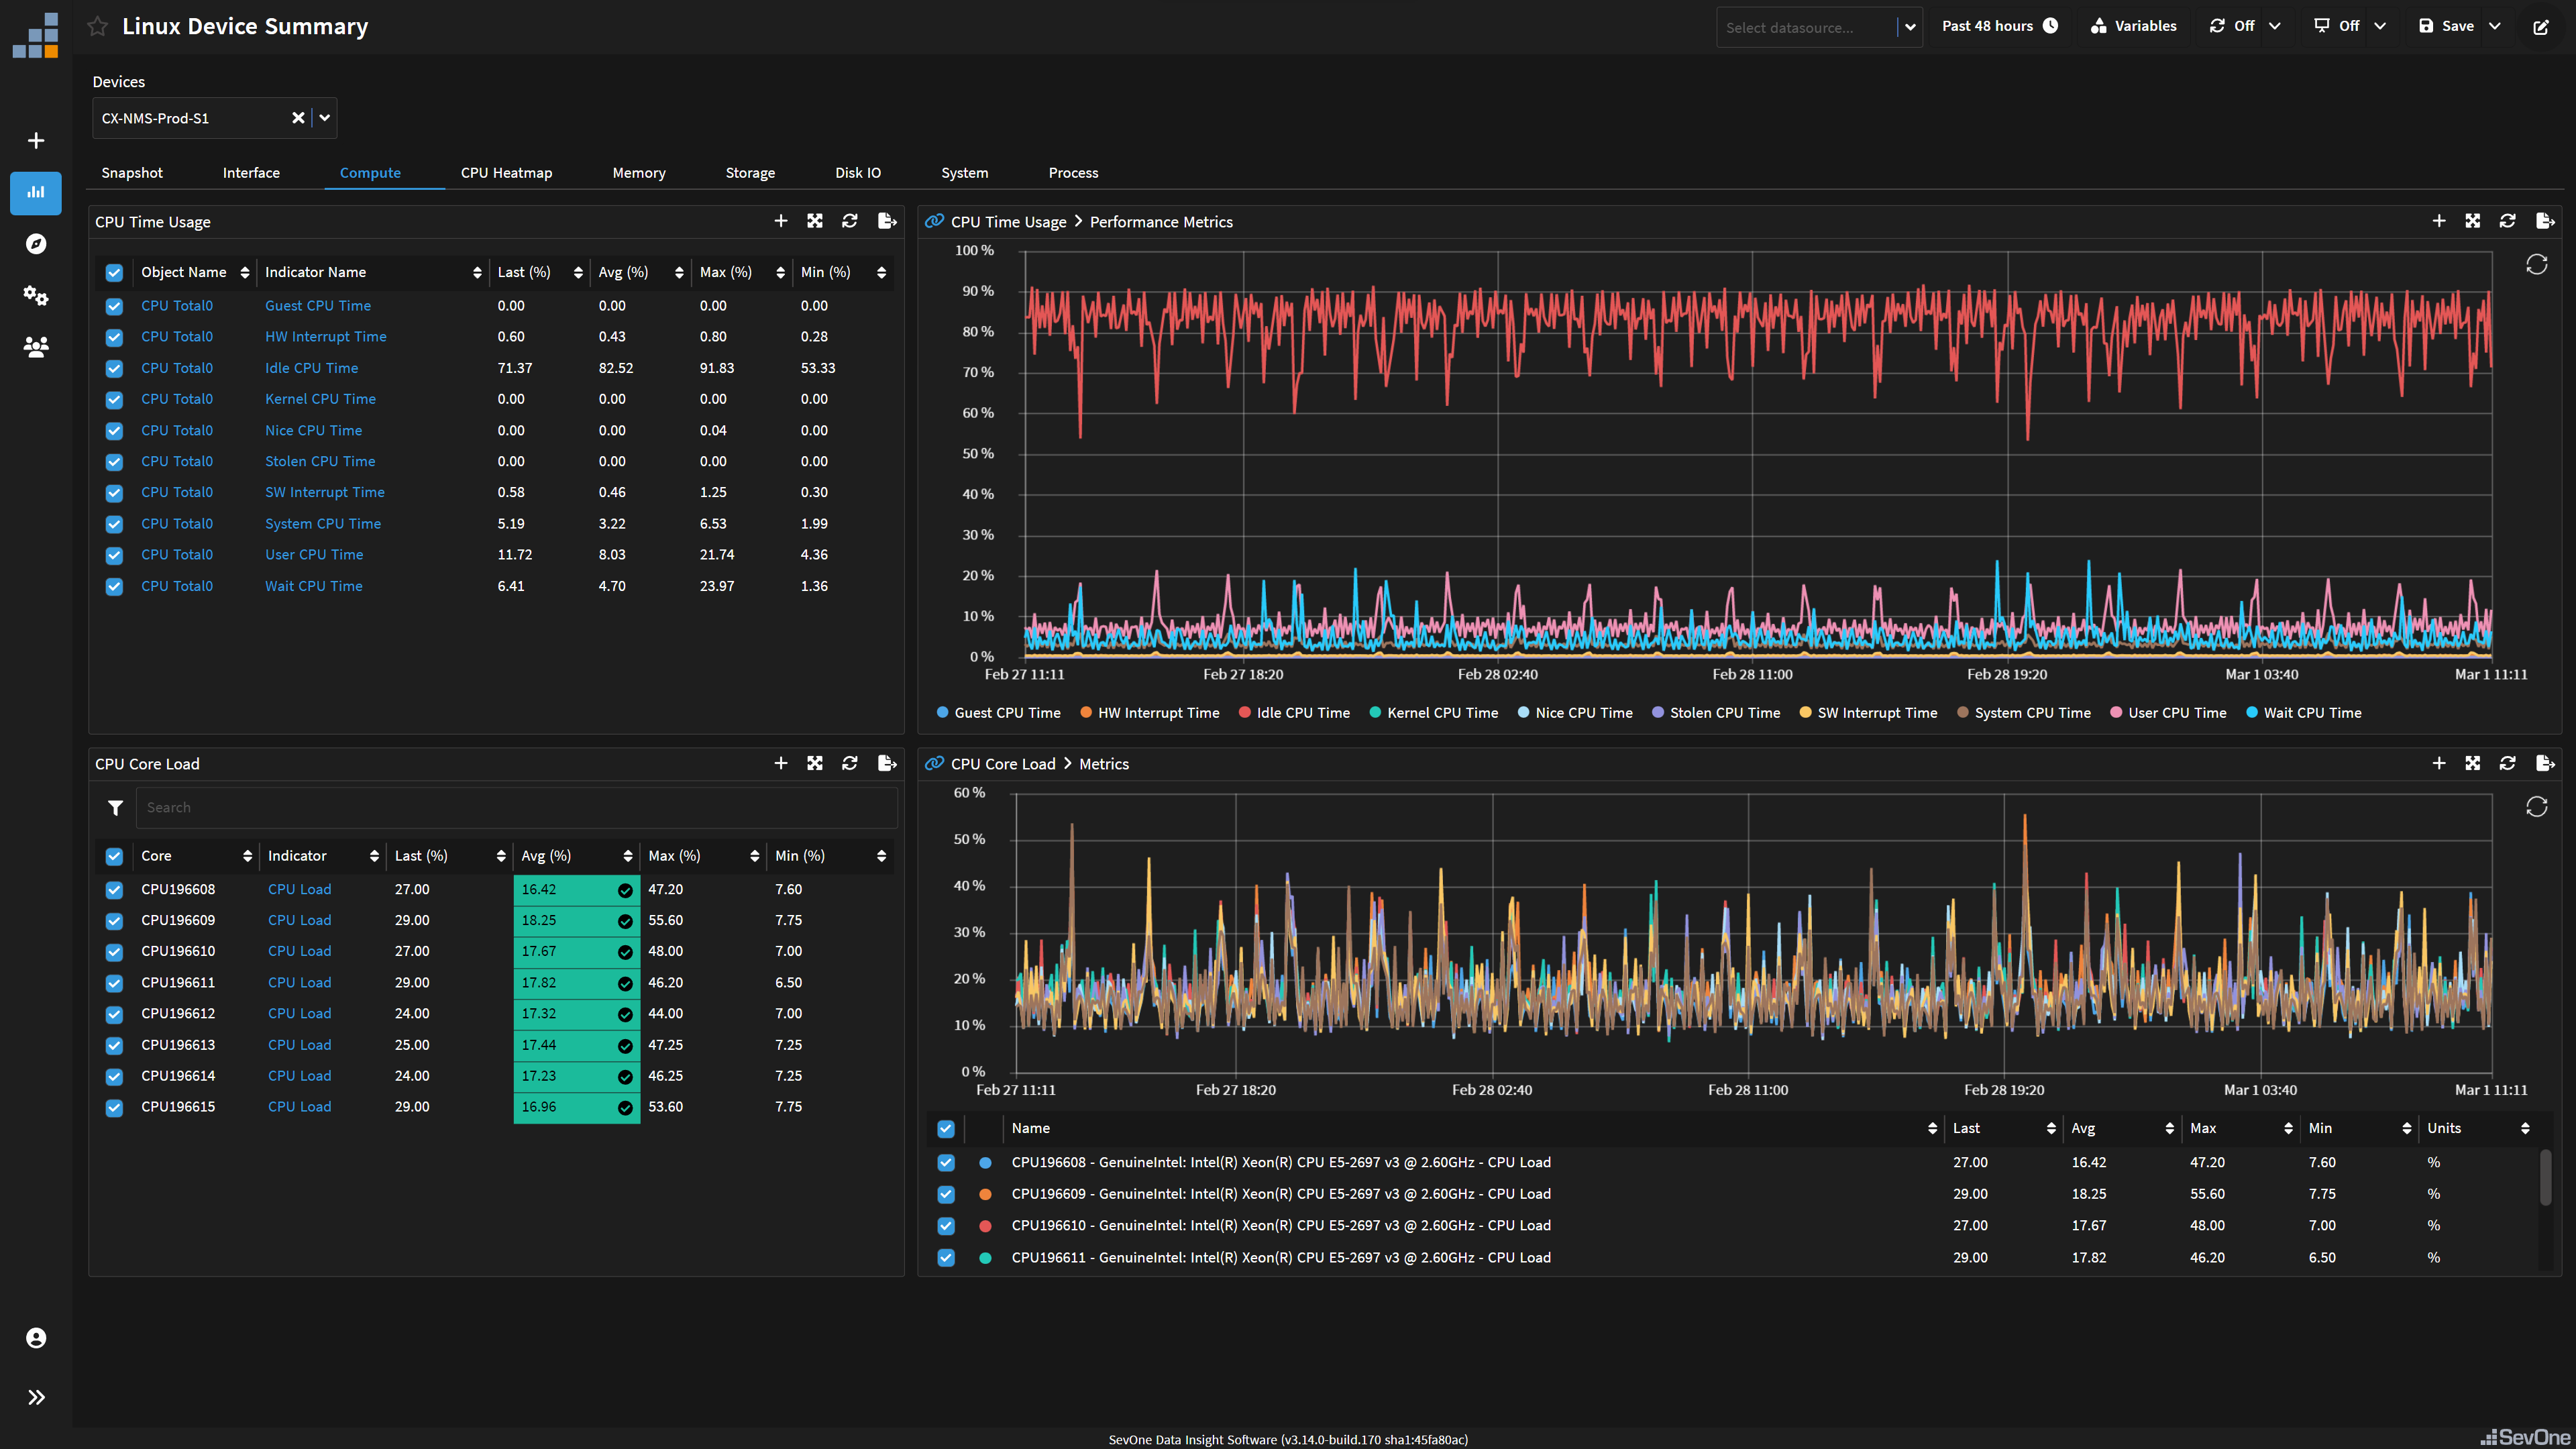
Compute
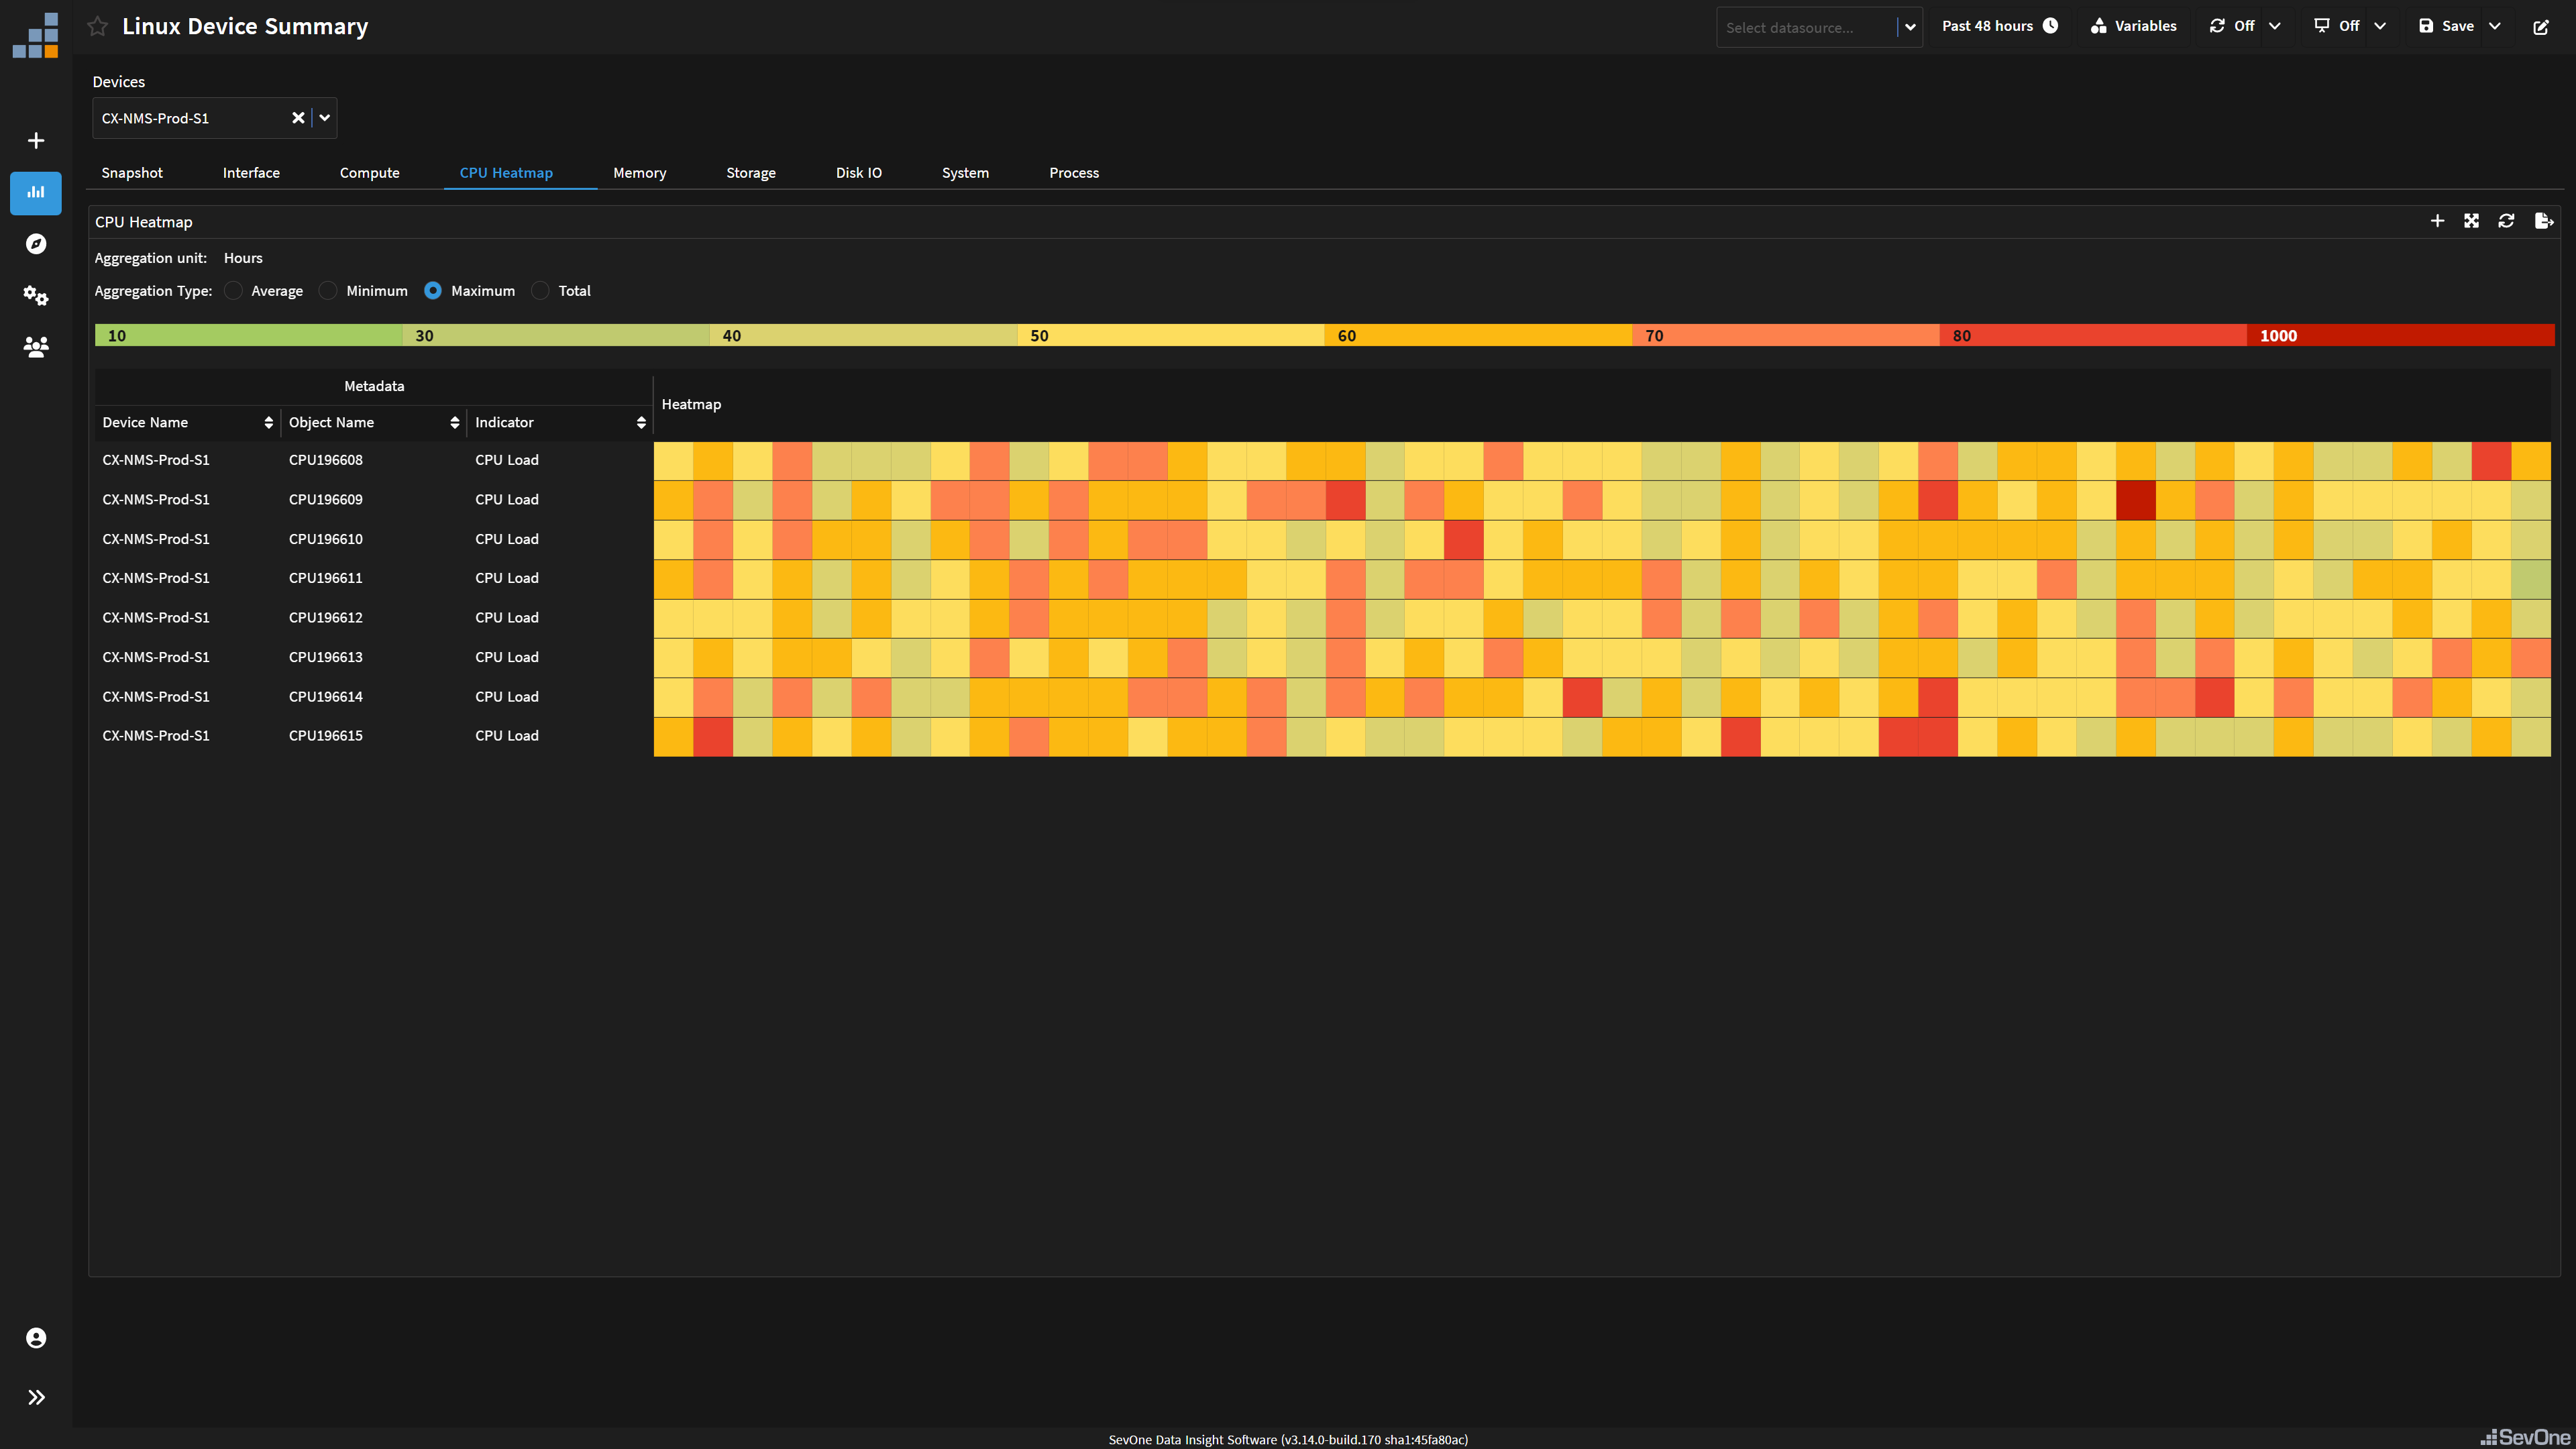
This top of part of this tab show stats similar to the $top command in Linux. What percentage of the time is the CPU idle? What is consuming CPU cycles? The bottom part of the tab shows shows the utilization for each CPU core on the sever. The next tab CPU Heatmap provides a different way to view core loads. It's a more useful way to visualize data on larger systems with several cores.
Memory
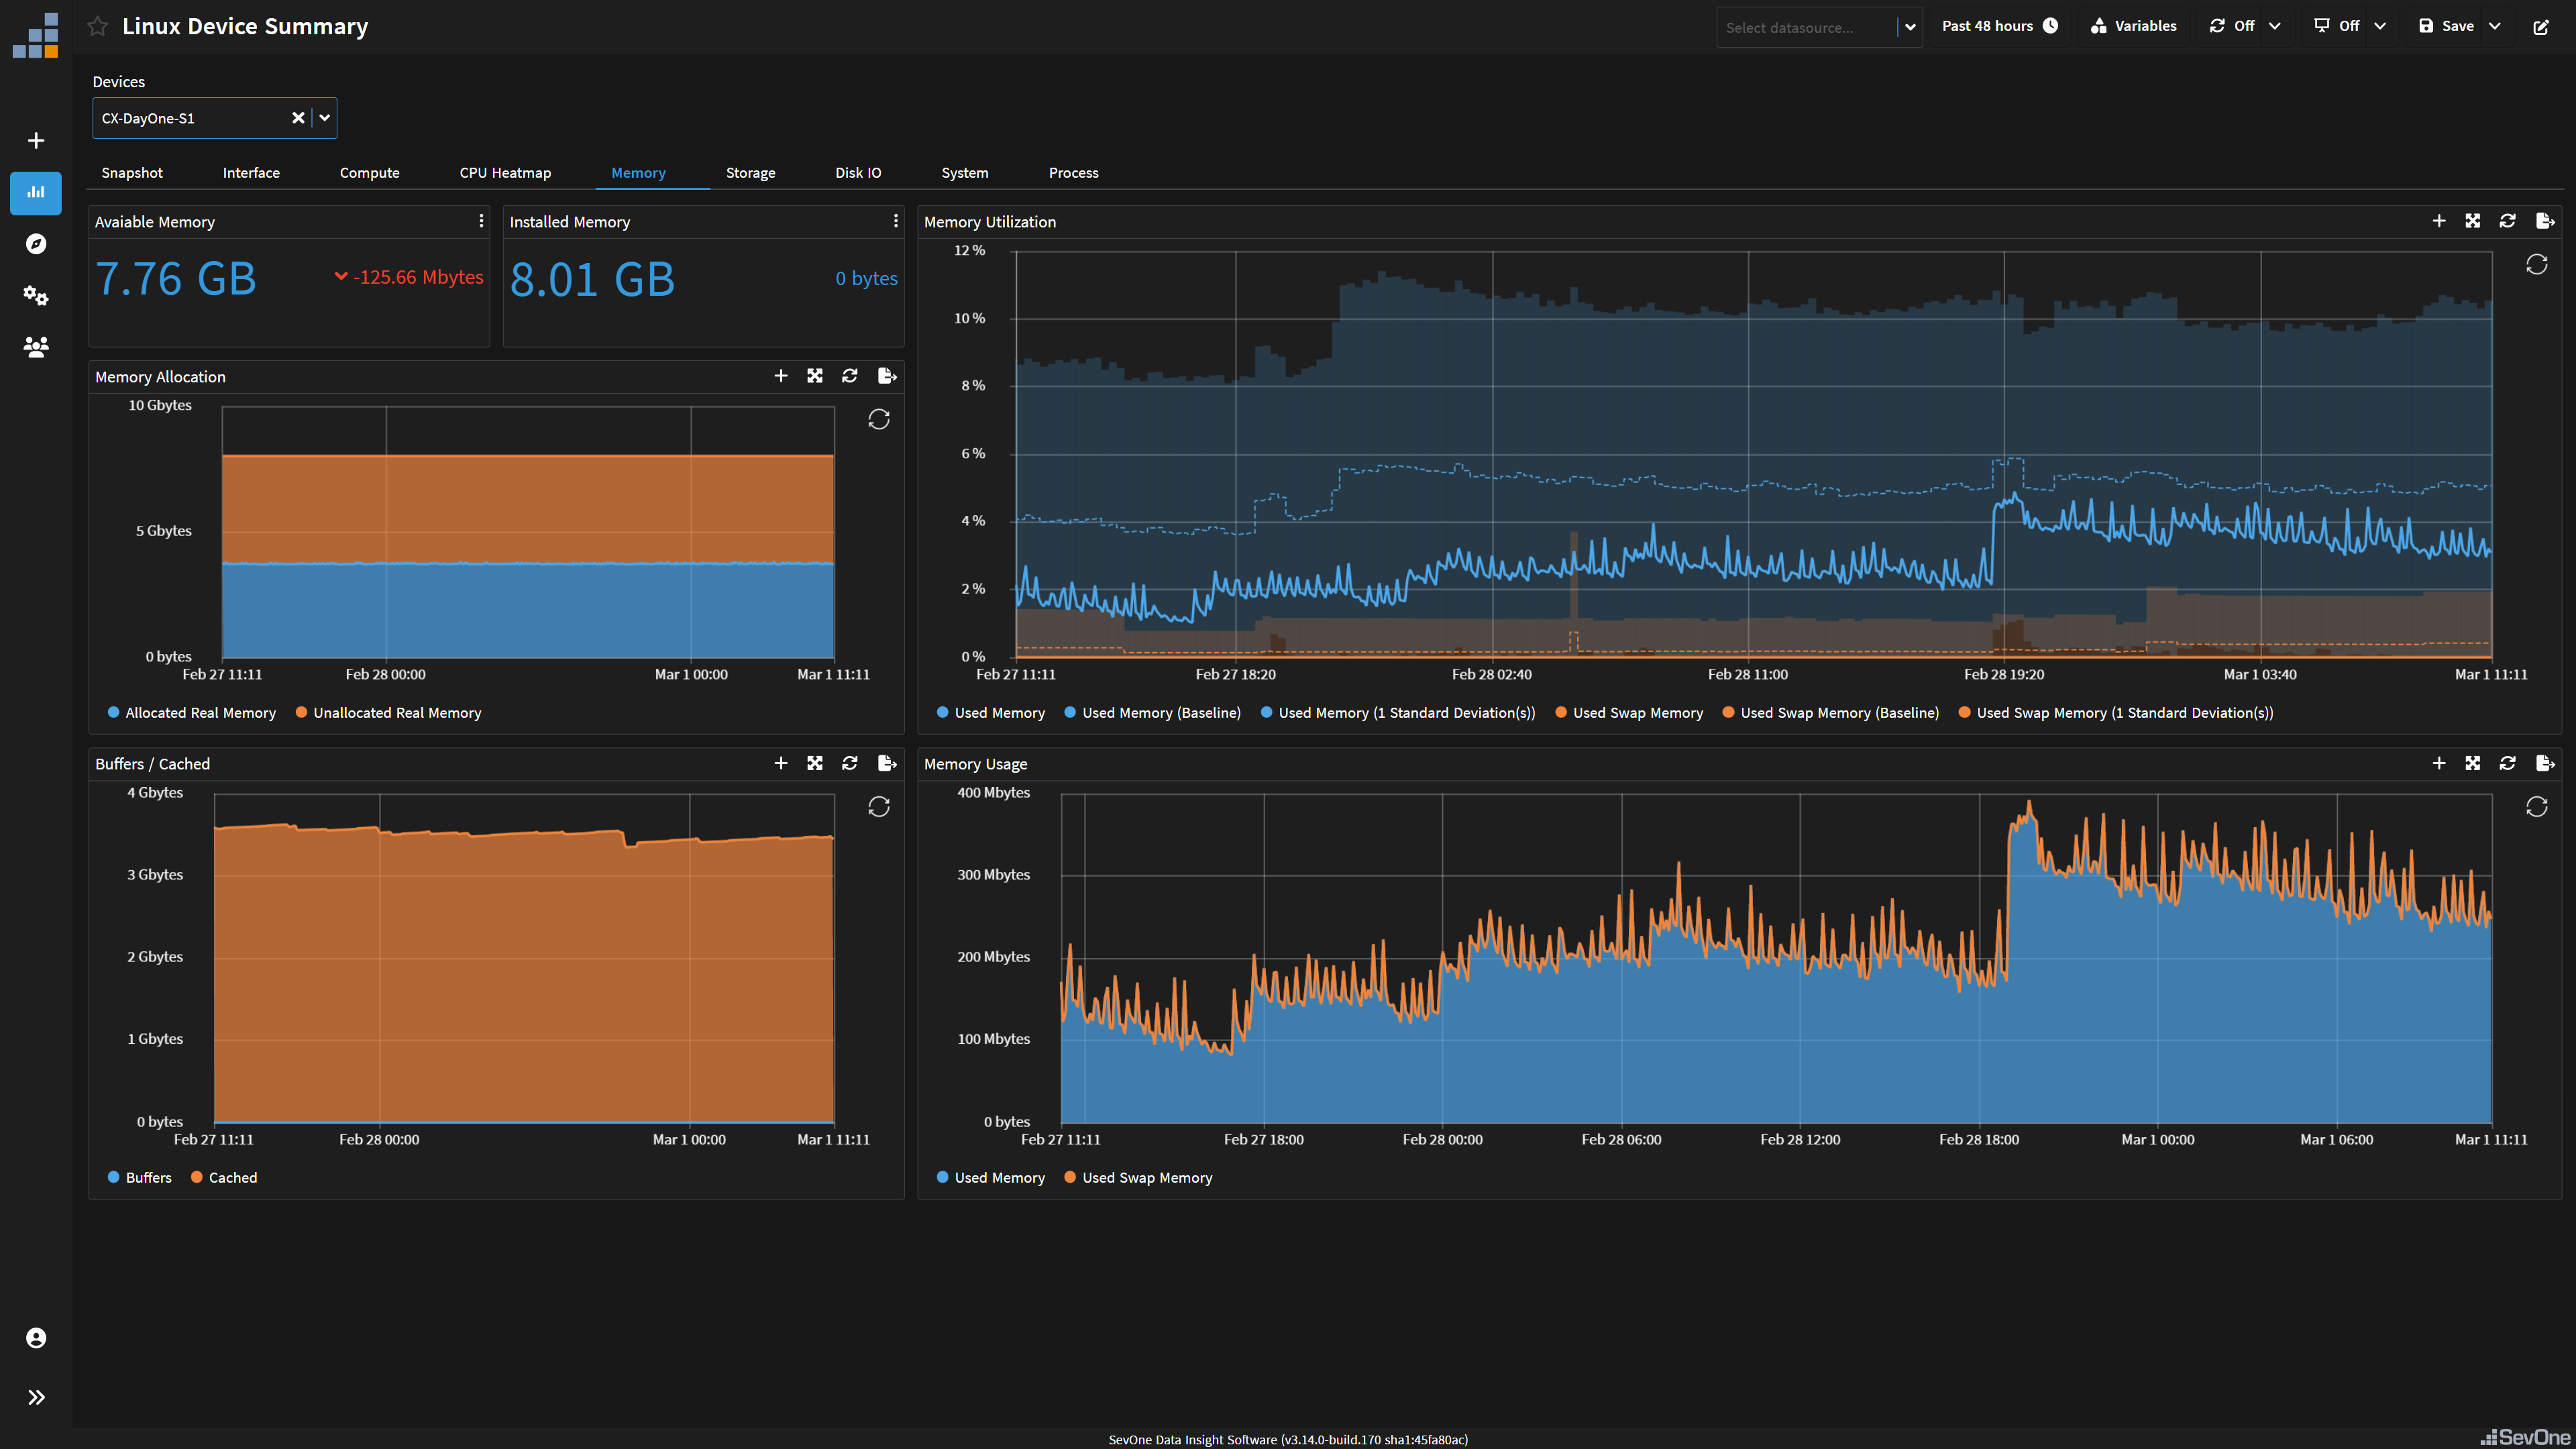
The memory tab will show installed and available memory on the system. Most importantly, it will show allocations and memory usage over time that's displayable in utilization or raw bytes. This always helps me understand when one of my VM's starts consuming swap memory. Also, notice the banding on the Memory Utilization widget that showcases SevOne's ability to baseline every indicator it collects to be able to know if something is normal or not.
Storage & Disk IO
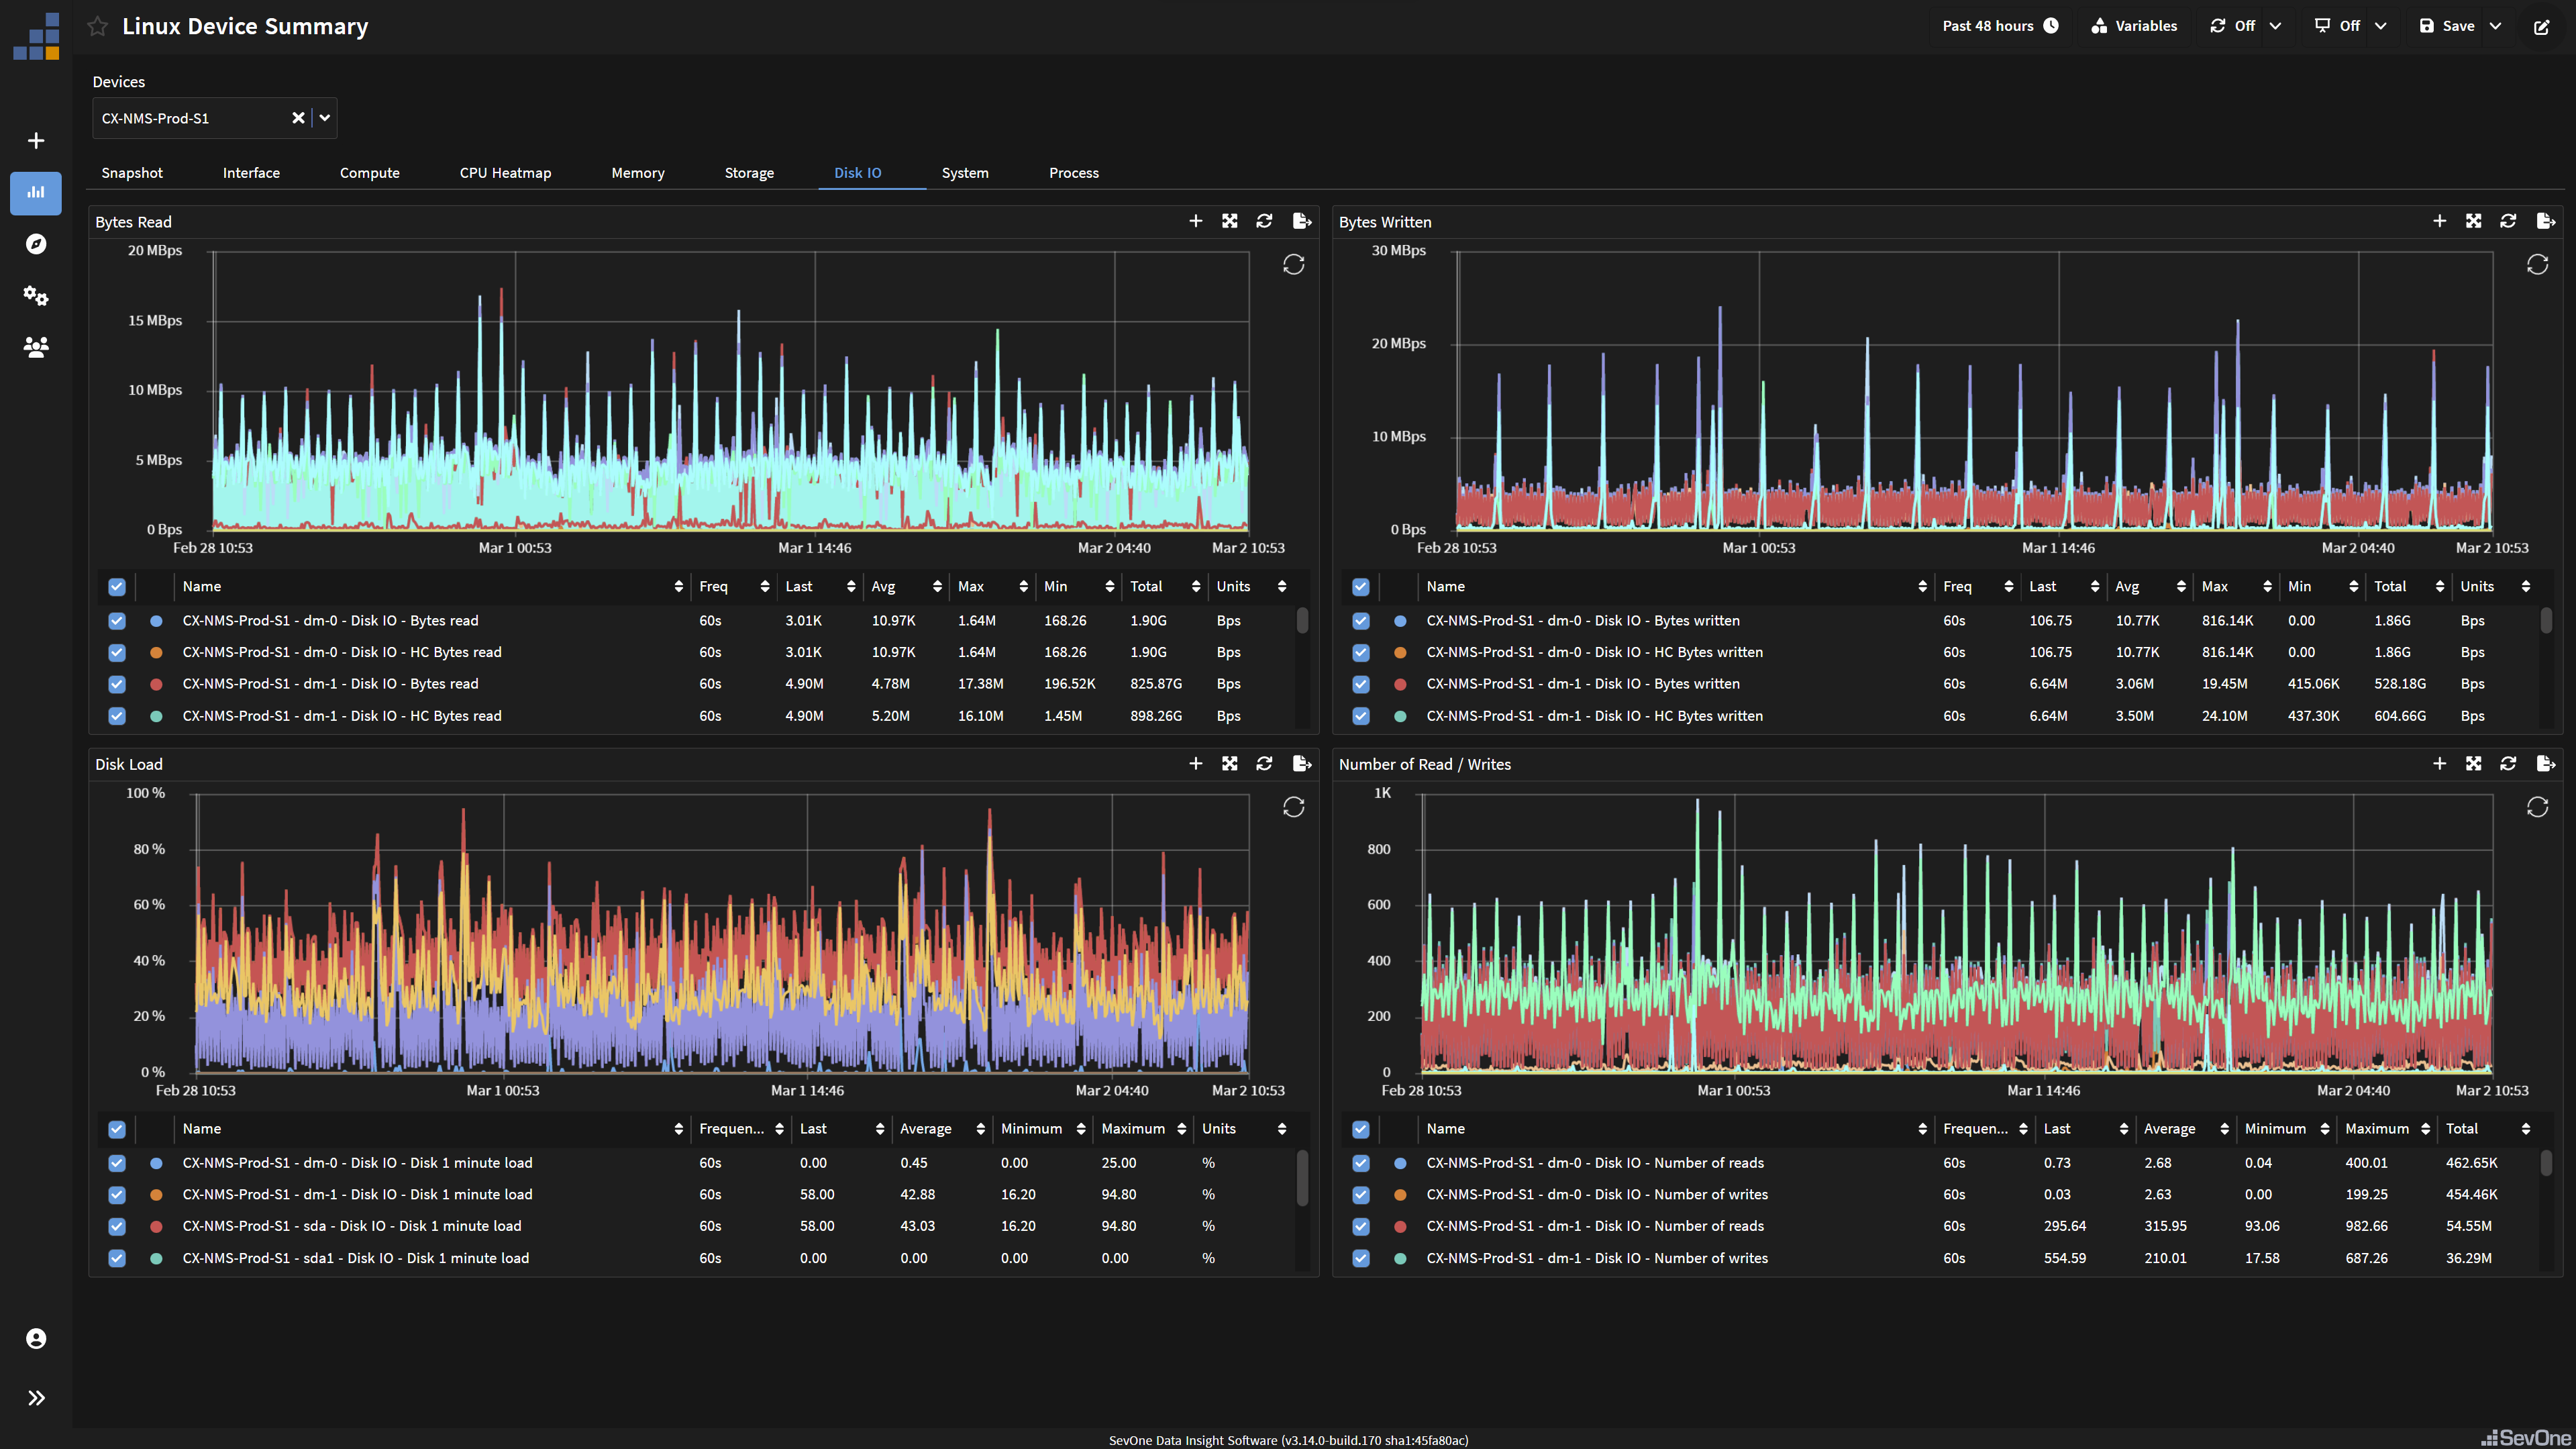
The next two tabs are about the basics of the storage and Disk input output. How much is consumed vs how much is available? Shown below on the Disk IO tab is read/write stats to different disks in addition to a Disk load % metric. This often helps with troubleshooting Storage Area Networking and IOPS related issues.
Process
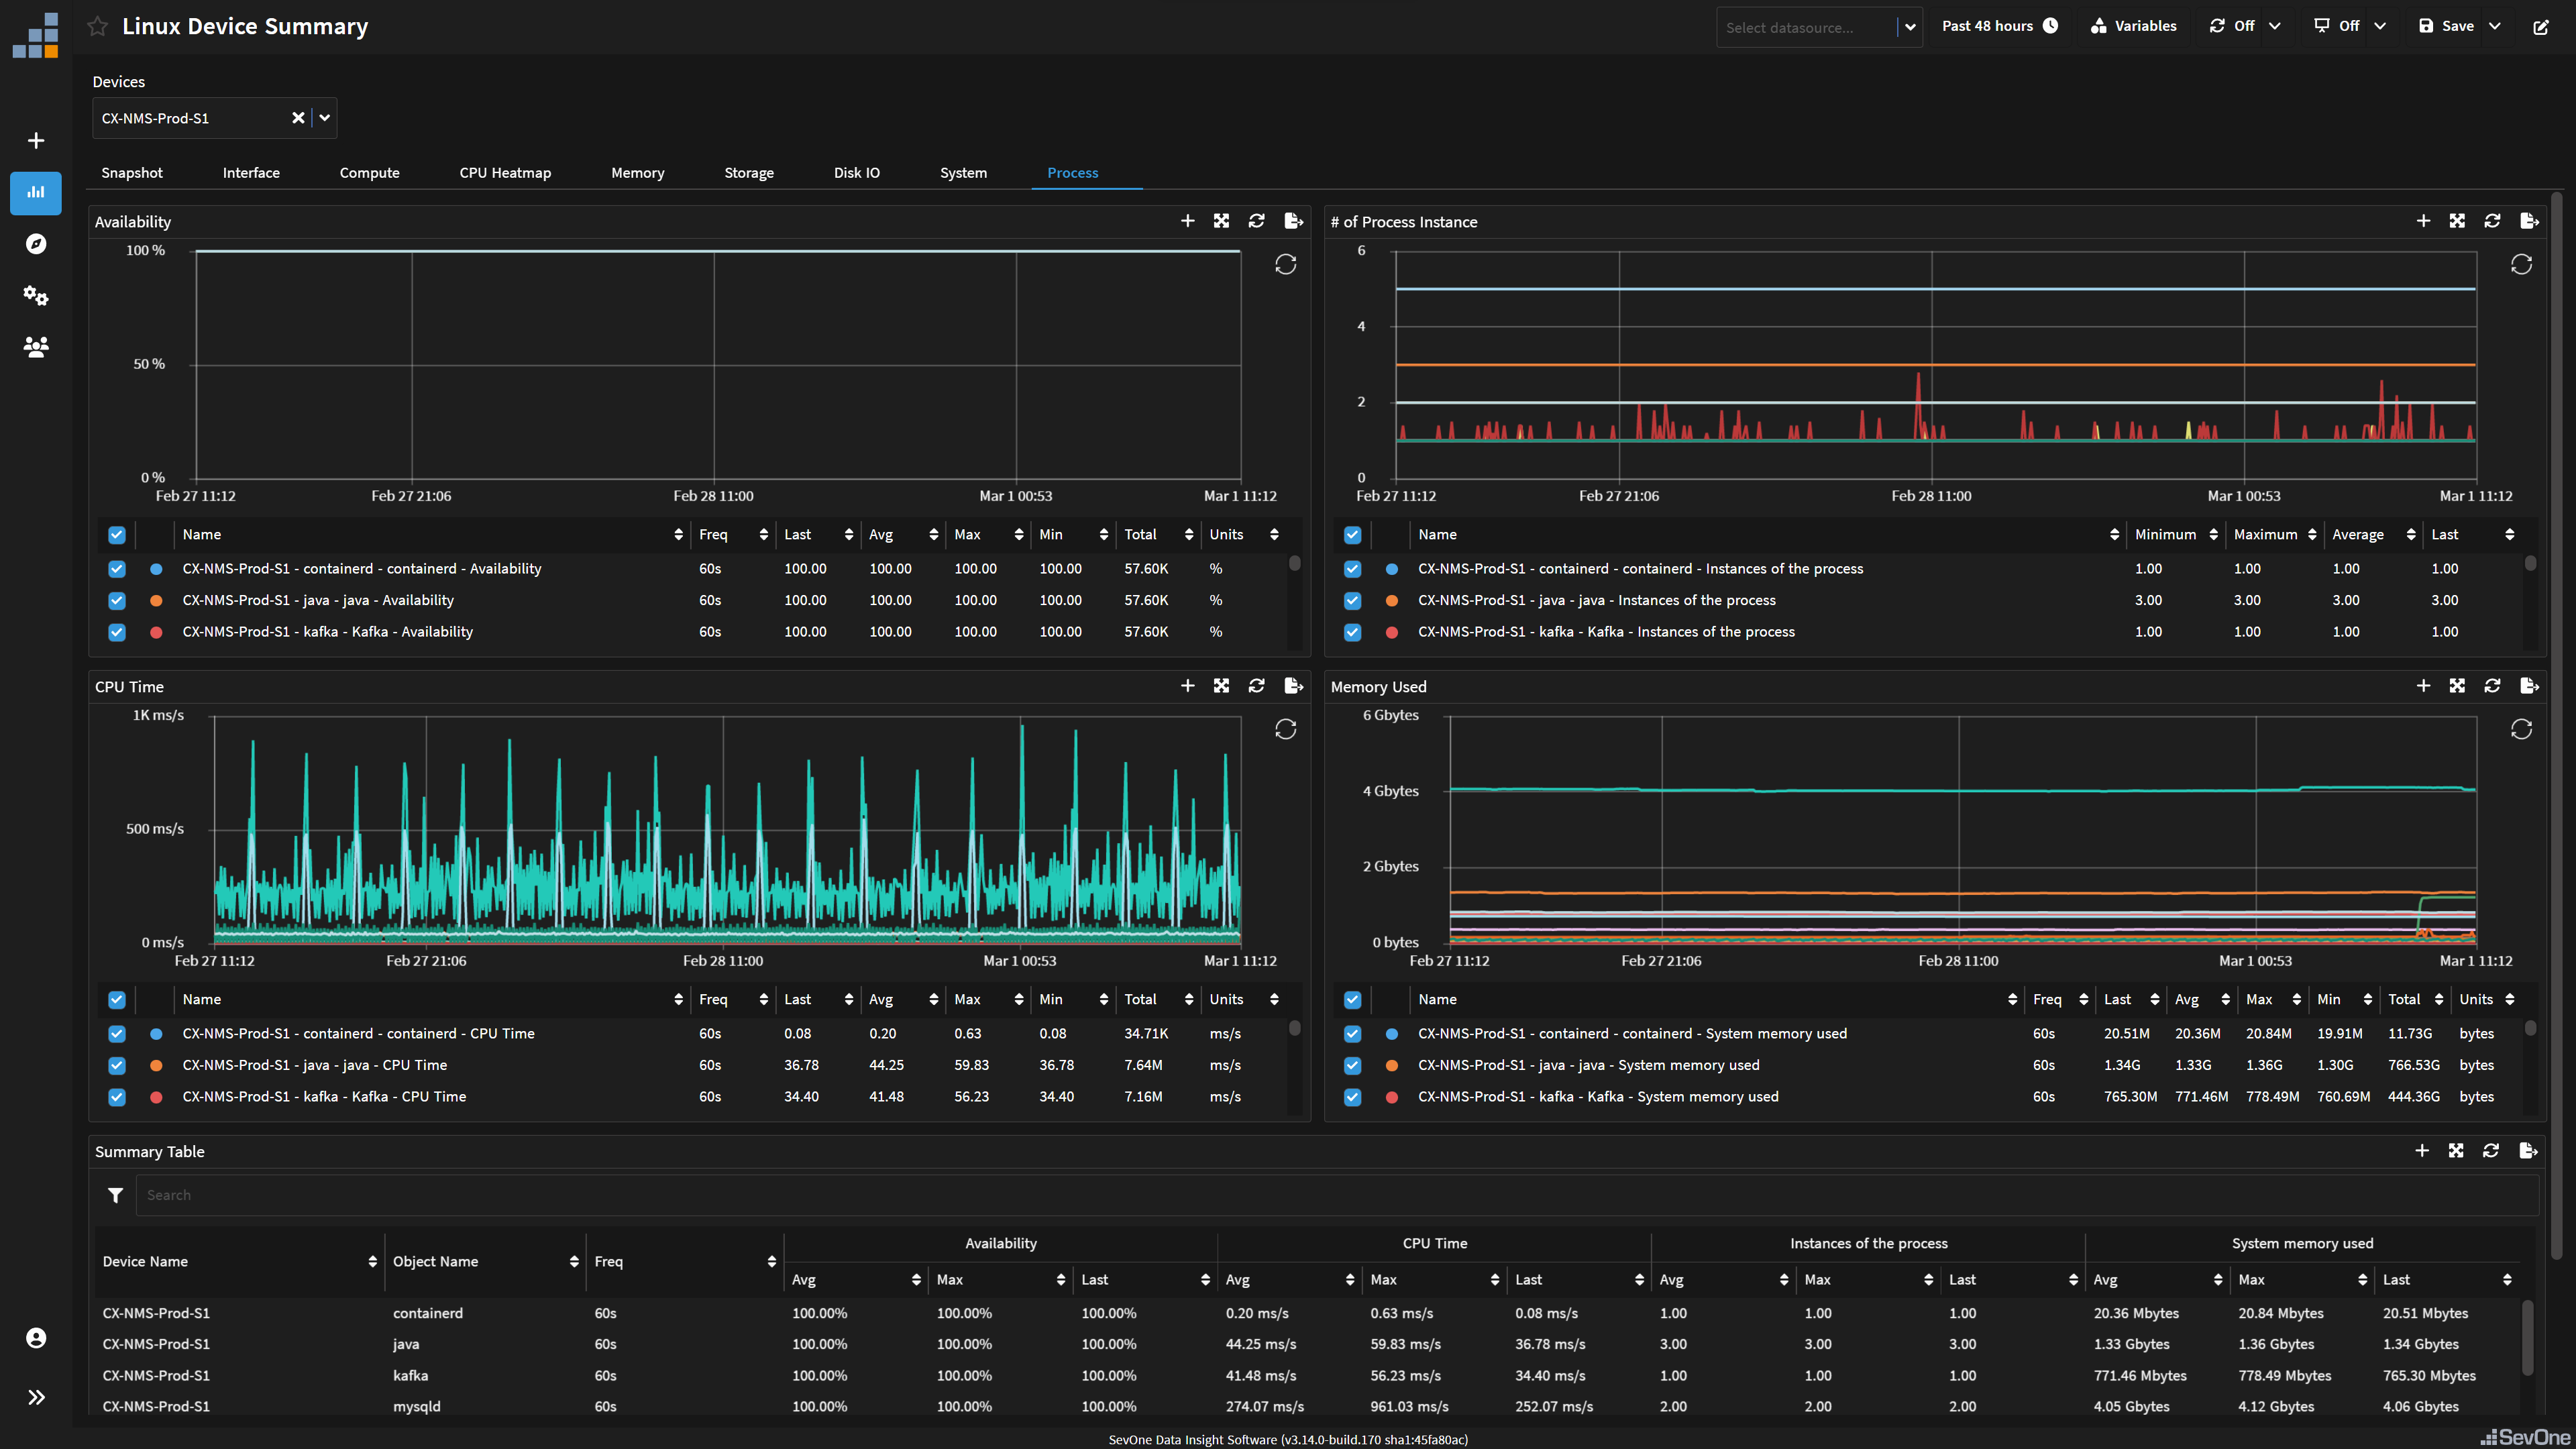
This tab helps identify some of the same stats shown above, but on a process level giving deeper insight into what's driving resource consumption.
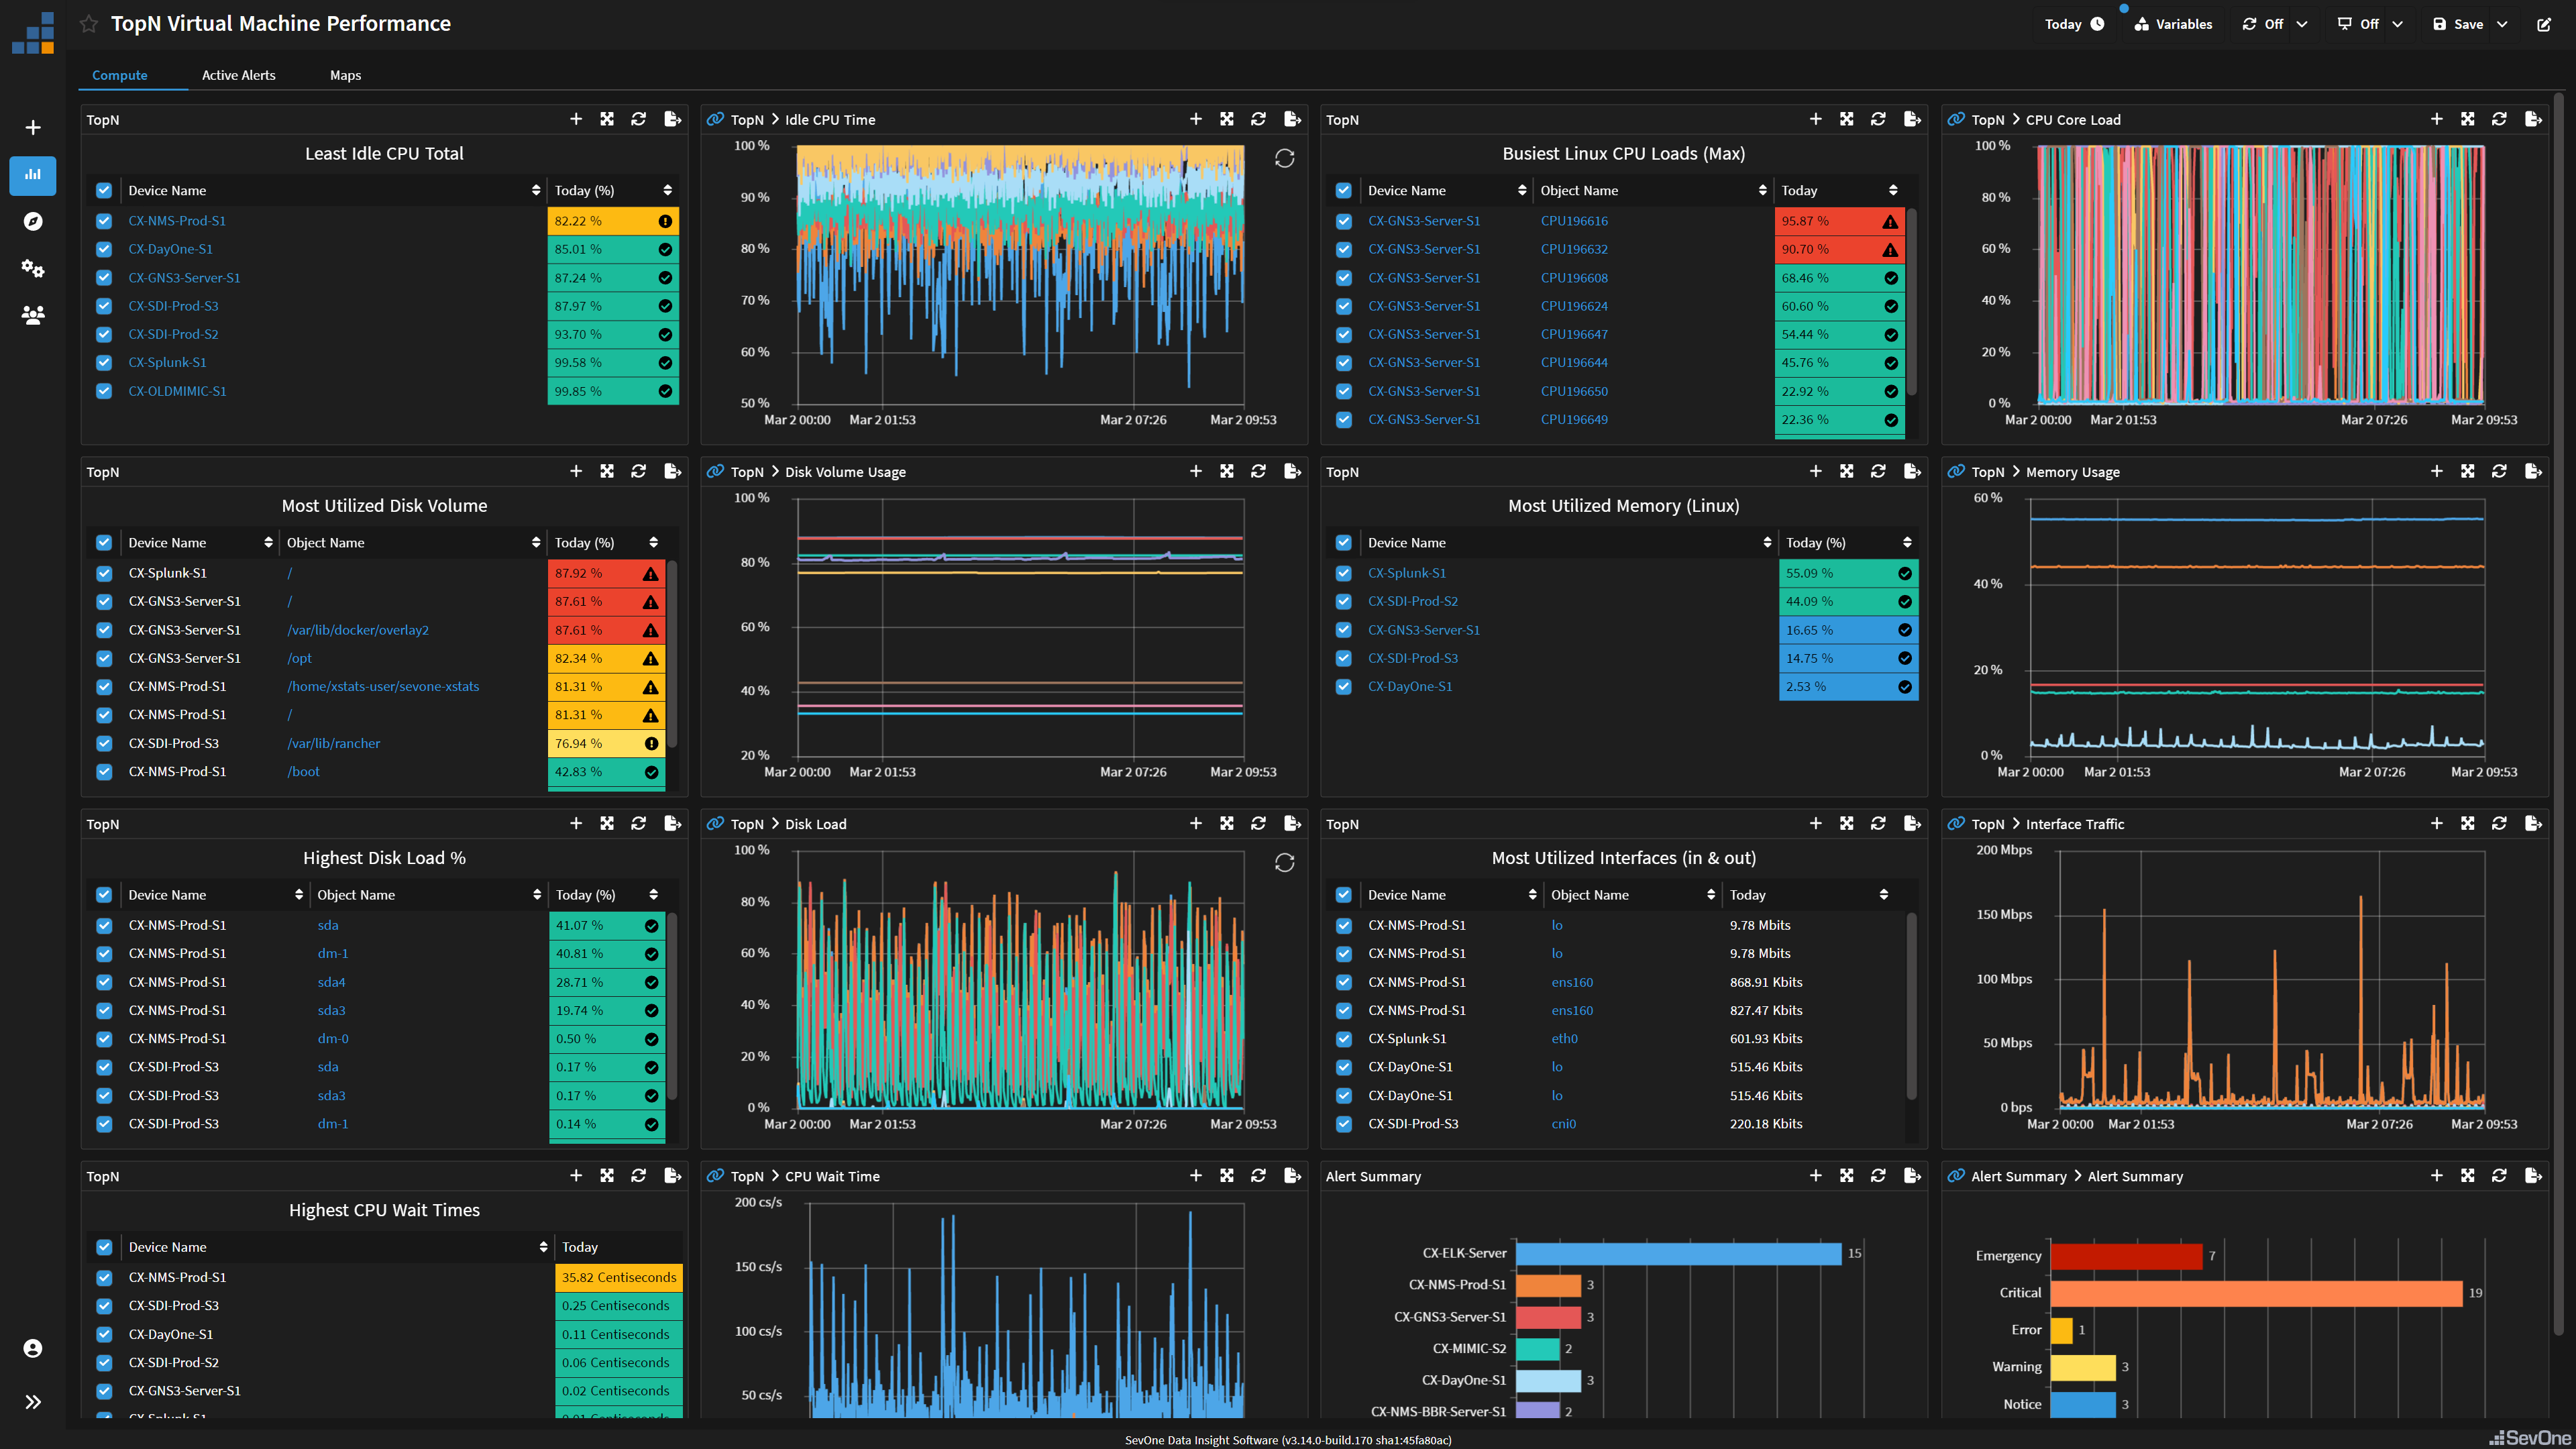
Taking it a step further
The SevOne NPM Data Insight user interface lets users create custom reporting to suit whatever their use case is. You can then link reports together into a workflow and drill down into specific objects and down to an indicator level. Here's how I keep an eye on my development environment! This report sorts all my VMs in order by key performance indicator in a table via the TopN widget and then draws the results over time. Want to know more, ask in the comments!