Performance problem: Definition
There are many reasons on what constitutes a performance problem. Most of those revolve around slow response times or high resource usage.
Here are some examples of situations in which performance problems become evident:
- A bottleneck is suspected in one of the system resources such as processor, I/O, or memory
- The overall system slows down.
- A query, application, or system hangs
- The workload or a batch job is not completing within the expected time duration, or a reduction in the transaction rate or throughput occurs.
We will be focusing on analysing performance problems when we upgrade such as hardware or software and observe performance disparity.
Performance baselining
Assume that you have a running application and you have chosen a specific java version to build an application and with an optional middleware component(like WebSphere, WAS). When you deploy this application to production, you define a baseline. Baseline is an established value of the performance metric, prevailing in the initial configuration of an application. If there are any changes occur in the execution environment of the application, such as hardware or software upgrades, a new application rollout etc, and if you observe there is a disparity with performance metrics, then the said baseline can be used as a reference to compare performance metrics. It is helpful to measure both positive and negative implications of performance. If the performance decreases relative to the baseline then the next reasonable action is to perform a performance problem determination.
Performance problem determination
As described above, performance issues can occur due to various reasons. When it comes to performance debugging in the Java space for instance, it may be caused due to thread deadlock, excessive lock contention, a problem in the network layer, the process being caught in an infinite loop, hung threads ,a bug in a software component, or due to insufficient system etc.
This blog helps you to debug and resolve issues when you have a performance problem due to any software upgrades such Java, WAS, OS or code changes in the application. As stated above, for starting a performance problem determination the most essential thing to have is a baseline and then the problem context. The problem context is compared with the baseline and the specific stack component is identified or isolated. The stack component can be OS, JVM, middleware or the application.
Performance debugging: Methods and Isolation techniques
The recommended approach of performance isolation is top-down. That is, we identify the top level module or component where the said performance degradation can be confined. For example: OS, middleware, JVM or the application. This is achieved by measuring the CPU slice spent in each of these components / layers and comparing the corresponding slice from the baseline. We do this many times iteratively, until we distil down the degradation to a specific shared library, module, class or a method.
Let us take a specific example. Suppose you have upgraded glibc and suppose glibc doesn’t show performance degradation in general, but started showing degradation when a Java application is launched. To isolate this performance problem, you can run a CPU profiling for the process by using linux perf
There are additional documentation available that explained the performance sample collection and interpretation in detail.
Suppose we applied the above methodologies such as baselining and isolation, and in a specific case, the performance problem is isolated at the Java level. Use IBM Java Healthcenter which will show method-wise CPU consumption .
Problem determination: Case study
Consider enabling IBM Java Health Center to check CPU and profiling data,
IBM Monitoring and Diagnostics for Java - HealthCenter is a performance profiling tool for IBM Java. It includes a statistical CPU profiler that samples Java stacks that are using CPU. The profiling data shows which methods are using the most processing resources.
To illustrate the usage of HealthCenter to perform performance problem determination, let’s take two variants of sorting methods - Bubble Sort and Merge Sort. Let’s assume merge sort logic is our baseline and bubble sort logic as the problem context .With respect to a large input ‘n’, we would expect a much lower value of the complexity rate in merge sort(O(nlogn)) as compared to bubble sort(O(n^2)). For example, with a data set of 3,00,000 variables, merge sort takes approximately 10 seconds to complete the sorting operation in the baseline environment. However, on the other hand, Bubble sort takes approximately 3 minutes 16 seconds to complete. We will find one method which responsible for the performance degradation using IBM Java HealthCenter.
Bubble Sort: Pseudo Code
Procedure BubbleSort( A : list of sortable items )
   repeat
     swapped = false
     for i = 1 to length(A) - 1 inclusive do:
       /* if this pair is out of order */
       if A[i-1] > A[i]then
         /* swap them and remember something changed */
         swap( A[i-1], A[i])
         swapped = true
       end if
     end for
   until not swapped
end Procedure
Merge Sort: Pseudo Code
function merge_sort(list m)
    // if list size is 0 (empty) or 1, consider it sorted and return it
    // (using less than or equal prevents infinite recursion for a zero length m)
    if length(m) <= 1
        return m
    // else list size is > 1, so split the list into two sublists
    // 1. DIVIDE Part...
    var list left, right
    var integer middle = length(m) / 2
    for each x in m before middle
         add x to left
    for each x in m after or equal middle
         add x to right
    // recursively call merge_sort() to further split each sublist
    // until sublist size is 1
    left = merge_sort(left)
    right = merge_sort(right)
    // merge the sublists returned from prior calls to merge_sort()
    // and return the resulting merged sublist
    // 2. CONQUER Part...
    return merge(left, right)
Running the application with HealthCenter
There are two ways to gather HealthCenter data:
- Headless mode: writes monitoring data to local disc (as .hcd files). It can be enabled with option -Xhealthcenter:level=headless
- Socket mode: direct TCP connection from a HealthCenter client to a JVM with the HealthCenter agent enabled and data is streamed to the client. It can be enabled with option -Xhealthcenter:transport=jrmp,port=1972
For this case study we are using socket or live mode to collect HealthCenter data and HealthCenter client is running as a eclipse plug-in on the local machine.
Profiling view
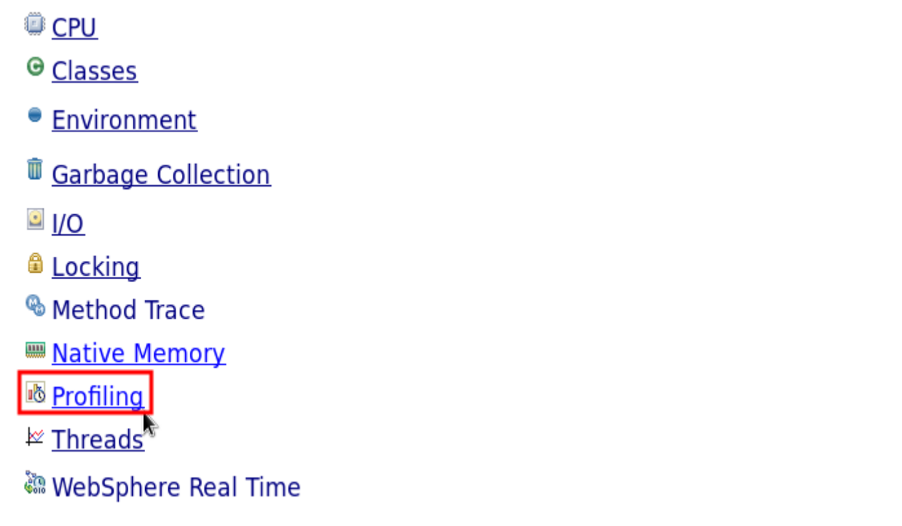
In the HealthCenter client, click the Profiling link. By default, the list is sorted by self-percentage which will show very hot methods
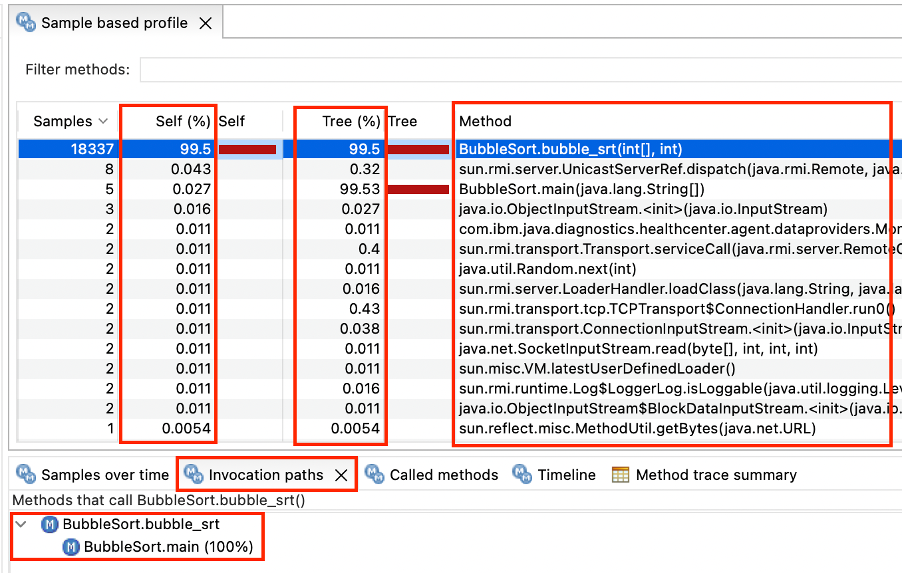
The Self (%) column reports the percent of samples where a method was at the top of the stack . It simply means, Self (%) is the percentage of CPU consumed by the method itself. The Tree (%) column reports the percent of samples where a method was somewhere else in the stack. It simply means, Tree(%) is the cumulative consumption of a method and all it’s callee methods together.
In the below snapshot, BubbleSort.bubble_srt method was sampled more than 99% of the time and we can see that most of the CPU is spent on bubble_srt method. If we click on this row, we can expand the "Invocation Paths" to see which methods call above method. The "Called Methods" view may be further reviewed to investigate the details of this usage
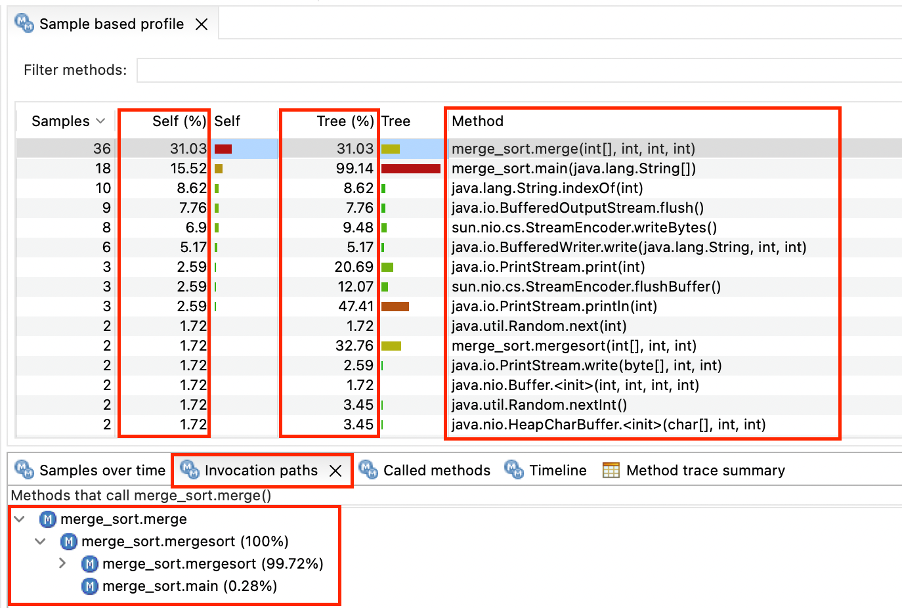
In the below snapshot, merge_sort.merge method was sampled more than 31% of the time. As compared to Bubble Sort example, merge short was sampled way less .
So in summary, once we establish a baseline and load the application in the problem context with HC configuration, collect data and launch the client, it is very intuitive and simple to perform the performance analysis, isolate the component, module, class and methods that impart in the degradation.
Performance best practices
- If you find your application getting short on memory and paging heavily, add more memory to the system to buy more bandwidth to the paging space.
- Fix memory leaks in your application. A memory leak is bad because it blocks memory resources and degrades system performance over time.
- Set an appropriate Java heap size to deliver optimal throughput and response time. JVM verbosegc output helps in determining the optimal settings.
- Configure thread and connection pools to enable sufficient concurrency. This is important for high volume, highly concurrent workloads, because the thread pool settings directly influence how much work can be concurrently processed by the server.
- Run the application in a profiler like IBM HealthCenter and monitor CPU usage and Look for those methods where the CPU spends most its time.
- For the top methods in your application, work out where the time is being spent. Is it all I/O? Calculations? Multi-thread synchronisation? Object allocation/deallocation? A poor algorithm with n-squared or worse complexity? Or Something else?
- Each time if you change anything like code changes or software upgrades, measure and work out whether you've actually improved anything. Roll back the ineffective changes and work out where the problem has moved to if the change worked.
- Make sure you are using the latest version of every product because there are often performance or tooling improvements available.