By Sameer Lodhi and Emmanuel Ramos
In this blog we will walk through the end-to-end performance testing process for WebSphere Application Server, both Traditional and Liberty. This topic touches on performance testing, and performance test creation also highlighted in Vijay Sundaresan’s Introducing the WebSphere Performance Engineering Team blog series. This will be a high level overview of our end-to-end performance testing process.
When doing performance runs for QA you must be able to produce repeatable results on a stable environment. If you are not able to obtain repeatable results it will often leads to either false positives, or regressions that are nothing more than red herrings. For repeatability, we will need to reduce the components that can introduce variance into the results. Some of the components that might introduce variance are hardware components. Some of these components would include processors, memory, network. Similarly OS components like, unrelated processes, background OS activity, firewalls, and anti virus checks must also be understood and avoided if at all possible. The following are some of the things we do to obtain repeatable results:
- Warmup runs; this will help get classes Just in Time (JIT), and any cache/pools populated. By including a warmup period we give the compiler a chance to produce optimal code. If we don’t include the warmup period the benchmark will be measuring the compilation time rather than the code it is attempting to measure.
- Multiple measurement iterations, to reduce variance.
- Keep systems and environment as pristine as possible (System under Test, Load Driver, Database).
- Clear class cache for server, reset and restore database tables.
- Restart system before each test run to have system in default state.
To achieve optimal performance we have verbosegc enabled for all our runs, which we recommend as well. The verbosegc logs can be viewed using Garbage Collection and Memory Visualizer (GCMV).
We take the original code for WebSphere Application Server build (Traditional or Liberty) that is to be tested for performance for any benchmark. It is installed on our system under test (SUT) by Installation Manager (IM) through our test automation. We first start with gathering a baseline data by setting up a testing environment. Then, run the test 3-5 times to see what the performance values are in that environment.
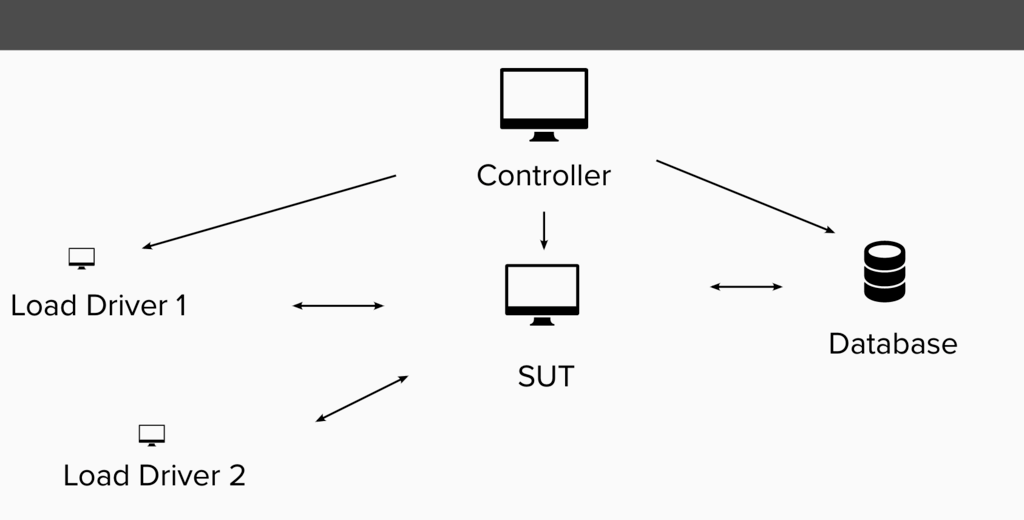
Test Infrastructure
Once all the test setup is done, then the actual test is kicked off from the controller system. We use two load driver instances in our case. We use JMeter tool in most scenarios to push the load to the SUT. We also have one separate system for Database where applicable. For throughput scenarios we perform 3 warmup runs and 3 measurement runs. For throughput scenarios we also want to get near 100% CPU saturation for best repeatability. For startup and footprint scenarios we perform one warmup run and then 20 measurement runs. We take average of the measurement runs and compare that to our baseline.
Results are compared between target build and baseline build. Because of run-to-run variability we have a threshold of +/-3% to consider any improvements or regressions. If there is regression over 3% then we re-validate the regression and investigate the issue. We use healthcenter to collect profiles and use NMON to collect CPU usage data. These profiles and CPU logs are analyzed to find the root cause of the issue. Once we have identified the root cause and collected all the details we proceed to open the defect for the respective team.
Next we work with the development team to get the fix for the regression in a timely manner. After the fix has been put into the target build, then we test it out with our automated test runs and verify that the regression is no longer present. Finally, we go ahead and close the defect. We are currently running close to 100 tests for traditional WAS and around 300 tests for Liberty. We run those tests almost every week, this testing process and frequency allows us to ensure high performance is maintained and no performance regressions creep into our products.
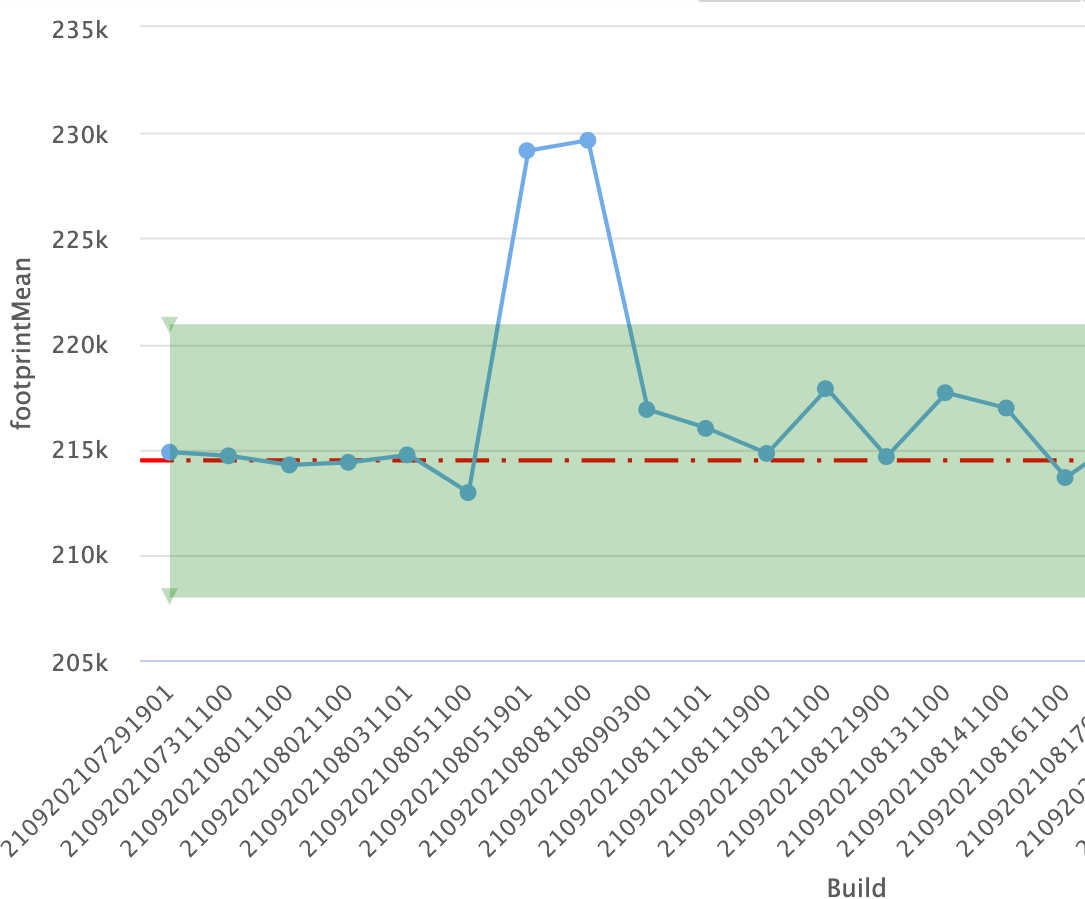
Footprint scenario, target vs baseline comparison (Y-axis: Process size, lower is better)
Here is an example of a regression that was found in a footprint scenario. The red line is our baseline build result and each data point is our target build results. We can see that after the first few builds a regression was introduced beyond 3%(green box) above the baseline. After working in coordination with the development team to fix the footprint regression, we can see in the chart above, that the footprint mean went back down to 215MB.
In conclusion, this is a high overview of one of the processes we follow to verify the performance of WebSphere Application Server, we believe these ideas could also be applied to any other products or applications.
#websphere-performance#Liberty