By: Don Bourne, David Chan, and Prashanth Gunapalasingam
The WebSphere Application Server (WAS) observability squad has just released a new sample application which exposes WAS Performance Monitoring Infrastructure (PMI) metrics in a format suitable for use with Prometheus. You may already be visualizing your WAS metrics in the administrative console using the built-in Tivoli Performance Viewer (TPV) tool but possibly you're looking to modernize your monitoring to take advantage of APM or simple metrics monitoring tools with more advanced features.
Enterprise applications are composed of front end logic for UI rendering, application logic spread across redundant servers and possibly distributed in microservices, databases, messaging engines, and many other components. So the idea of having a central interface to be able to monitor all of the pieces is compelling.
For basic metrics monitoring, one such solution is to use Prometheus to scrape and store metrics and to use Grafana as a web-based front end for building dashboards and viewing metrics.
After upgrading to WAS 9.0.5.7, or installing an iFix for WAS 8.5.5.16 and later 8.5.5.x servers, you will see a new `metrics.ear` file in your `<WAS_HOME>/installableApps` directory. By installing the `metrics.ear` Prometheus will be able to scrape metrics from your entire WAS cell. We've also published a Grafana dashboard - ready to use with metrics scraped from your WAS servers. While you can easily customize a dashboard to include the metrics you care about, the sample WAS dashboard at grafana.com gives you a good place to start.
Getting Started
In order to get started, the `metrics.ear` application that is located in the `<WAS_HOME>/installableApps` directory, should be installed on a single WebSphere Application Server instance within the domain. If you are using a network deployment cell, you can install the `metrics.ear` application on a single server instance within the domain. For unfederated base servers, install the `metrics.ear` application on each server you want to collect metrics from.
We have created a self-contained quick start example using Docker compose, which installs the `metrics.ear` application on a single server, and sets up Prometheus and Grafana for you to quickly visualize the PMI metrics.The quick start example can be found here,where it contains a Docker compose file that sets up WASPMI metrics with Prometheus and Grafana in Docker containers. It will install WAS Base edition version 9.0.5.7 with the new `metrics.ear` application, set up and configure Prometheus to scrape the PMI metrics exposed from the WAS container and set up Grafana with the sample WAS Grafana dashboard.
Note: The example in the quick start guide uses Docker containers and Docker Compose. Ensure that Docker and Docker Compose are installed on your system following the installation instructions at https://www.docker.com
Configuring Prometheus to Monitor the PMI Metrics from WAS
Prometheus is an open-source monitoring platform widely used in Cloud deployment environments, such as Kubernetes. It collects metrics, in real time and stores it in a time series database. The core component of Prometheus is the main Prometheus Server that scrapes the metrics data that is in Prometheus format from an HTTP endpoint from monitored targets.
Prometheus can be configured via command-line flags or via a configuration file, that is written in YAML format (prometheus.yaml). We will be using the Prometheus configuration file to configure Prometheus in our example. The following example configuration file has two blocks of configuration: `global` and `scrape_configs`.
The `global` configuration specifies the parameters that are valid and serves as defaults for all other configuration sections. The `scrape_interval` controls how often Prometheus will scrape all the monitored targets, which can be overridden for specific individual targets.
The `scrape_configs` configuration controls which resources Prometheus monitors and specifies a set of targets and parameters describing how to scrape them. In this example, there is a single job, called `was-nd`, which scrapes the WAS PMI metrics data exposed by the `metrics.ear` application’s HTTP target endpoint (“https://<WAS_hostname>:<WAS_port>/metrics”), which is statically configured via the `static_configs` parameters. The `was_nd` job also specifies the `scrape_interval` of 15 seconds, which overrides the global configuration of 30 seconds.
# my global config

global:
  scrape_interval: 30s # Set the scrape interval to every 30 seconds. Default is every 1 minute.
  evaluation_interval: 15s # Evaluate rules every 15 seconds. The default is every 1 minute.
  # scrape_timeout is set to the global default (10s).

# A scrape configuration containing exactly one endpoint to scrape:
scrape_configs:
  # The job name is added as a label `job=<job_name>` to any timeseries scraped from this config.
  - job_name: 'was-nd'
    # metrics_path defaults to '/metrics'
    # scheme defaults to 'http'.
     scrape_interval: 15s
    static_configs:
    - targets: ['<WAS_hostname>:<WAS_port>']
If application security is enabled for the `metrics.ear` application in WAS and the user is assigned to a monitor role, the `basic_auth` parameter can also be added to the job, under the `scrape_configs` section, along with the login credentials for the WAS user having the monitor role, as follows:
- job_name: 'was-nd'
    scheme: `https`
    basic_auth:
      username: someUser
      password: somePassword
    static_configs:
    - targets: ['<WAS_hostname>:<WAS_port>']
The quick start example, found in the previously mentioned repository, already has a Prometheus YAML file configured to work with the bundled WAS Docker container. However, if you want to run a standalone Prometheus instance for your own WAS instance, you can do so, by running the following Prometheus Docker image and specifying your own Prometheus YAML configuration file, with the target to be scraped set to your own WAS instance’s hostname and port, that has the `metrics.ear` application installed.
docker run -d --name prometheus_standalone -p 9090:9090 -v <PATH_TO_PROMETHEUS_YAML>:/etc/prometheus/prometheus.yml prom/prometheus --config.file=/etc/prometheus/prometheus.yml
Visualizing your Data with Grafana
Now that you have Prometheus set up and running you can use the provided web client at http://localhost:9090 to submit PromQL queries to the Prometheus time-series database to retrieve and display metric data. However, this facility for retrieving the metric data is rudimentary. The metrics data can only be presented as a table listing or line graph. Although you can have multiple queries in multiple visualizations for presenting multiple metrics of interest, they only exist for your current session. It's possible to save and share the URL that dynamically changes with the contents of the page, but that is rather inefficient and insecure. Of course, this Prometheus web client was never intended to be your final step in your metrics monitoring solution. Prometheus is often paired with Grafana which is another open source monitoring solution that is used to illustrate and visualize your metrics time-series data. Grafana provides a much more feature rich platform withconfiguration elements for security, alerting and implementing dynamic variables. Grafana also has a long list of visualizations you can use. These visualizations can then be conveniently saved into a dashboard which can be shared and/or hosted on the Grafana server and secured through user-based access roles.
We have provided a Grafana dashboard that visualizes metrics from the following components: CPU, Memory Heap, Servlets, EJBs, Connection Pool, SIB, Sessions, Threadpool, Garbage Collection, and other JVM statistics. The dashboard can be downloaded from the Grafana community dashboards site.Depending on your deployment topology and PMI settings it can be the case that your `/metrics` endpoint may be inundated with large amounts of metrics, which may affect performance. The Grafana dashboard page also includes a wsadmin script that will modify the servers in your cell to enable the exact PMI stats needed for this Grafana dashboard. If you will be modifying the dashboard or creating your own dashboard, ensure that you enable the specific metrics that you want. We will cover performance tuning in the subsequent section.
If you chose not to deploy the quick-start demo, you will need to deploy Grafana manually. For example, using Docker:
docker run -d --name grafana_standalone -p 3000:3000 grafana/grafana
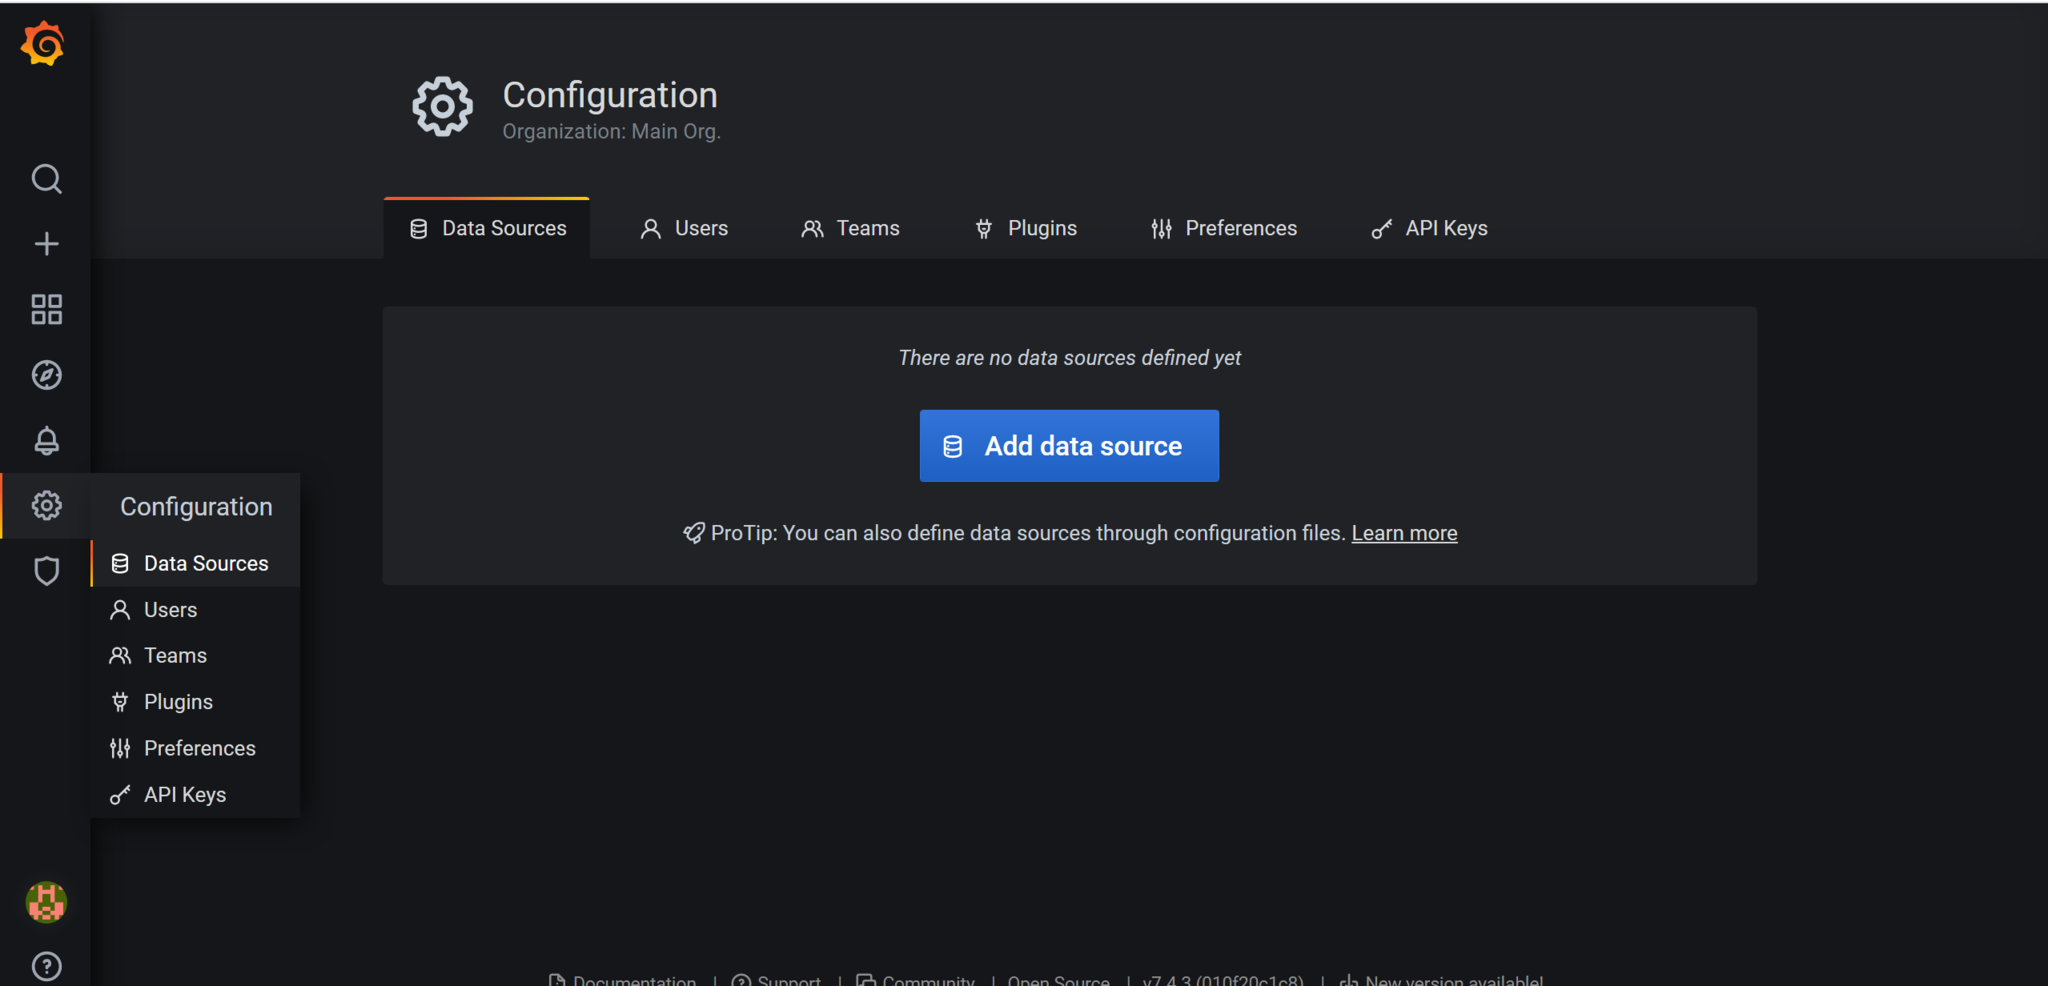
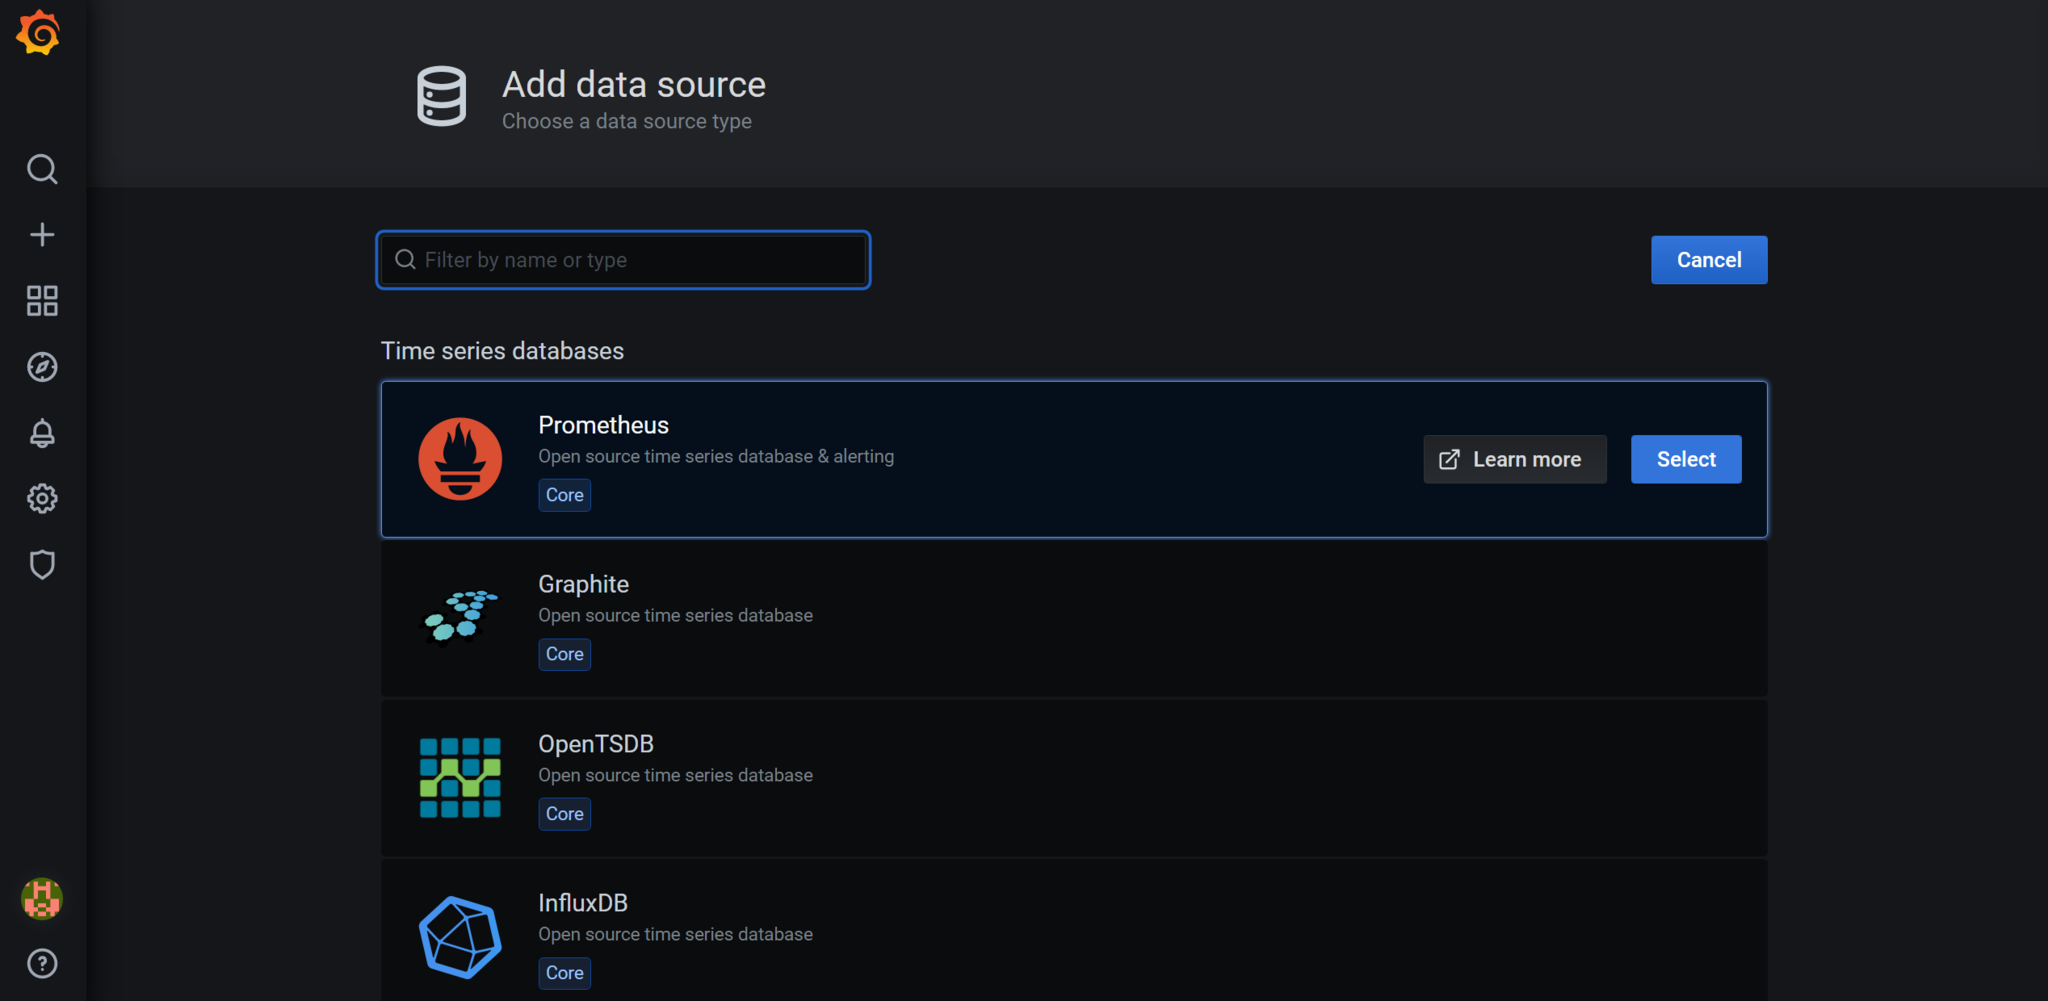
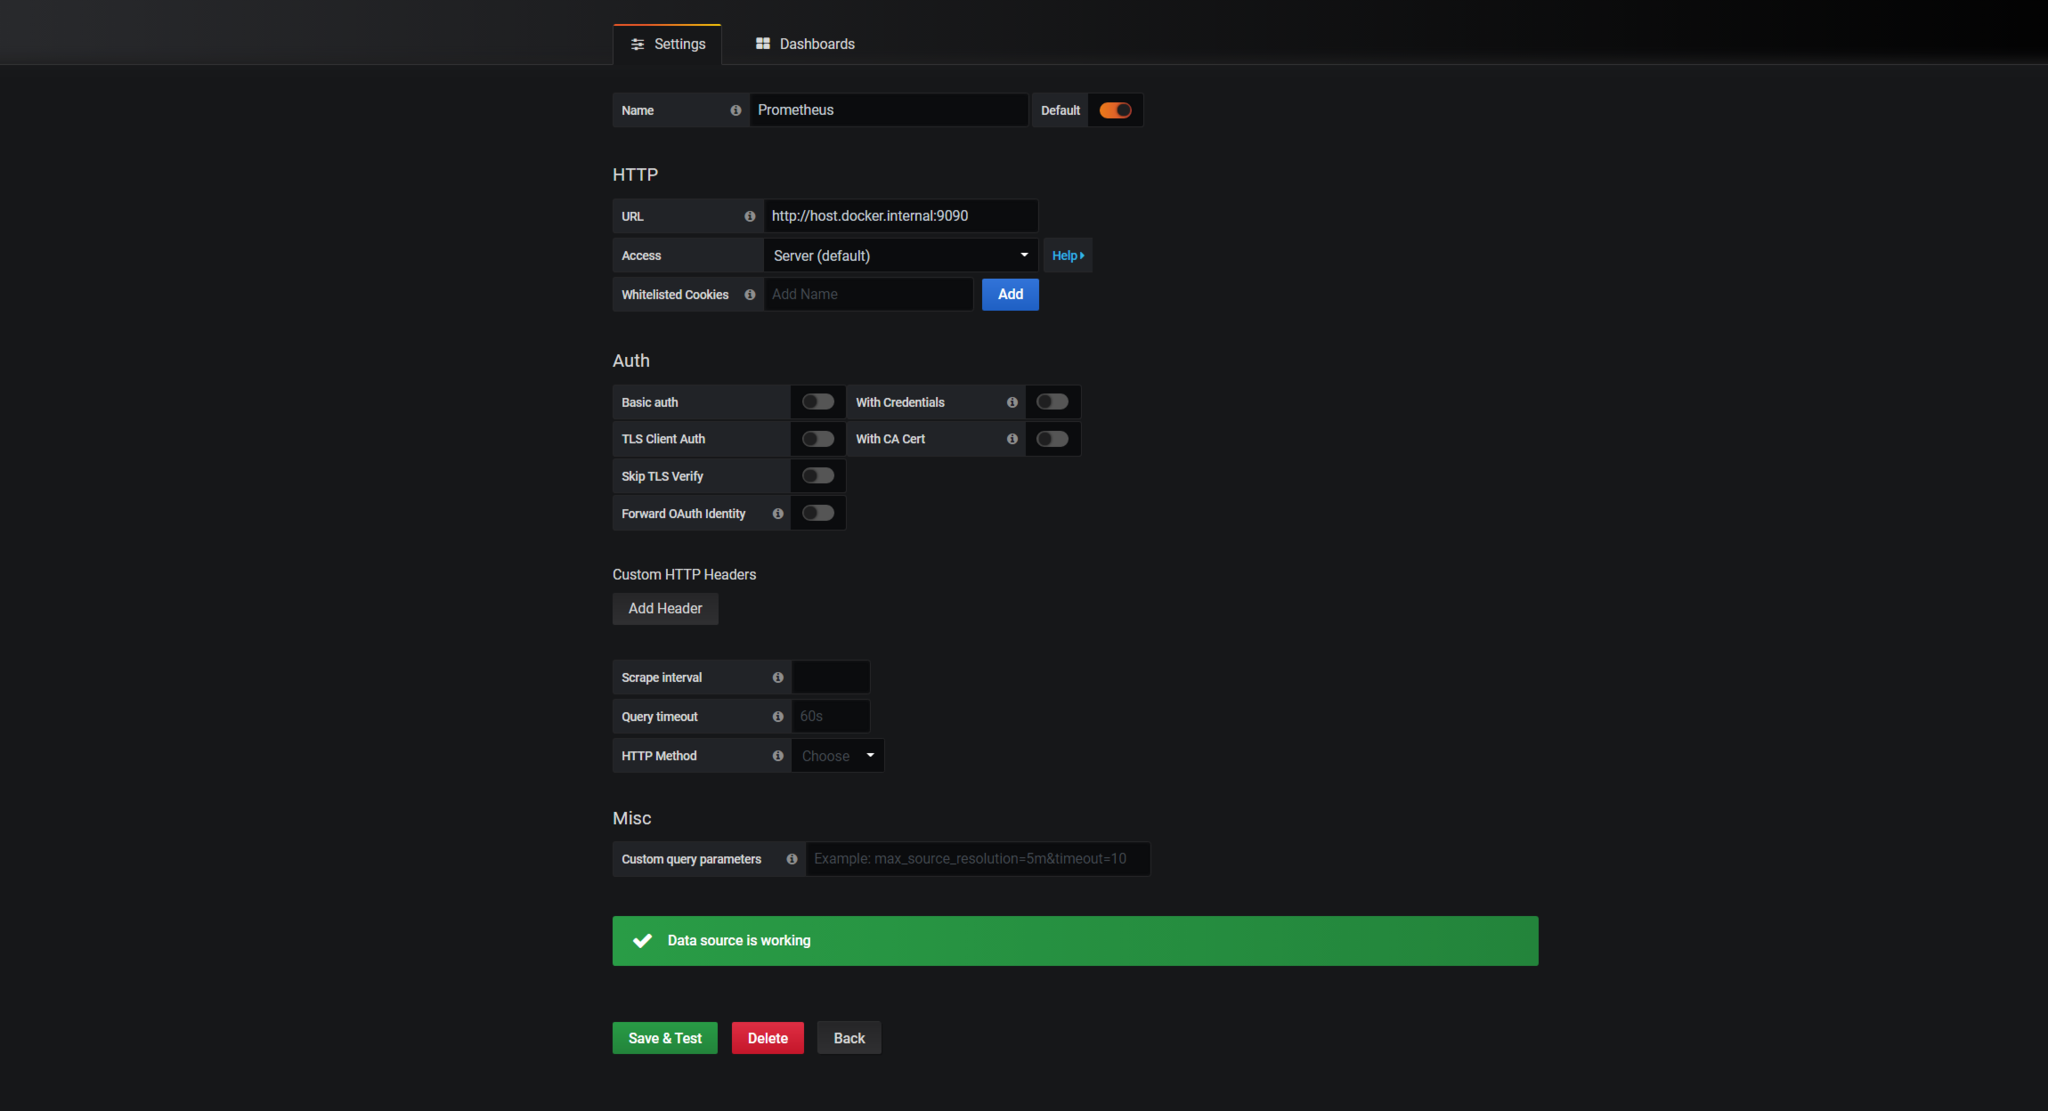
The below steps will outline how to configure Grafana to pull data from Prometheus:
1. Go to the Configuration > Data Sources > Add data source:

2. Choose the Prometheus data source:

3. Specify the target location for the Prometheus server. We will need to specify `host.docker.internal`:

Metrics Scraping Performance Considerations
The thought of hundreds or thousands or tens of thousands of metrics being processed at once may produce a shiver up your spine. Why? Because performance. Being able to capture metrics is great, but it needs to be fast. Performance was a priority when developing this feature and it does perform well under load, but there are steps that can be taken to produce the best results. Poorly performing nodes in your WAS ND cell can affect the ability of the metrics application to collect data. If a node is close to maximum CPU usage or has run out of memory, the entire metrics processing performance is impacted. Since metrics results need to be aggregated from all nodes before being presented, one thrashing node will impact the performance of the entire metrics data collection. The resultant long response time from the `/metrics` endpoint has a cascading effect. The Prometheus server by default has a 10 second scrape timeout. When an attempt to scrape a target `/metrics` endpoint times out, the scrape fails and no data is recorded for that interval. The result is empty time ranges in your Grafana visualizations.
To ensure you get good performance from your metrics application, check that all nodes have adequate CPU and memory resources for the workloads they are processing. Failing that, or if such configurations are out of your control, you can increase the value of the `scrape_timeout` in your Prometheus configuration file to better tolerate long metrics data collections.
The metrics application also comes with two configurable properties that relate to caching. The metrics application performs two main functions. Gathering and reporting metric data and keeping up to date with the server topology so that it can properly retrieve the metrics from all servers. Each of these two functions can incur significant overhead if executed everytime the `/metrics` endpoint is hit. As a result the data from these processes are cached to avoid such performance overhead. The two properties are:
- com.ibm.ws.pmi.prometheus.resultCacheInterval (5s default)
- com.ibm.ws.pmi.prometheus.serverListUpdateInterval (600s default)
The first property defines the cache interval for metrics results.
The second property defines the cache interval for the server list results.
Conclusion
You
can start monitoring your WAS cells in minutes with the new metrics app for WAS traditional. Give it a try and let us know how it goes!
Resources
For more information on using the metrics app to display PMI metrics in Prometheus format
hereFor more information on Prometheus
hereFor more information on Grafana
here #Docker#Featured-area-2#Featured-area-2-home#grafana#monitoring#observability#pmi#prometheus#websphere#WebSphereApplicationServer(WAS)#whatsnew