DevOps Automation

 View Only

Integrating Postman for Request Virtualization in IBM DevOps Test Integrations and APIs

By Paranshah Vyas posted Fri September 20, 2024 01:45 PM


This blog provides a guide on integrating IBM DevOps Test Integrations and APIs (Test Integrations and APIs) with Postman, utilizing the example included with the Test Integrations and APIs product. The emphasis is on recording and virtualizing the requests and responses generated by Postman.

API Details:

The example can be found at the IBM DevOps Test Control Panel URL. Open DevOps Test Control Panel -> Help -> Examples

This blog is divided into four major sections:

  1. Integration of Postman with IBM DevOps Test Integrations and APIs (Test Integrations and APIs)
    • Steps to connect Postman with Test Integrations and APIs for testing.
  2. Recording SEND Request and RECEIVED Response Events
    • Instructions for using Recording Studio to capture events from Postman in Test Integrations and APIs.
  3. Creating a Test from Recorded Events
    • Guidance on how to create a test based on the recorded events and virtualize the incoming requests in the Test Integrations and APIs workbench.
  4. Virtualizing Requests in IBM DevOps Test Control Panel (DevOps Test Control Panel)
    • Procedures for virtualizing requests received from Postman within the DevOps Test Control Panel environment.

Integration of Postman with IBM DevOps Test Integrations and APIs (Test Integrations and APIs)

You can set up the client to send HTTP and HTTPS traffic through a proxy (forward proxying). If the client cannot be configured with proxy settings, you can use a reverse proxy instead. In this case, you set the proxy as the endpoint for the client, and it will determine the destination. To do this, you need to configure a forwarding rule in the proxy that directs traffic arriving on a specific port to the destination.

The API proxy in this scenario utilizes port 3128 to listen for both HTTP and HTTPS messages.

The Postman application is considered to be a client here. We will configure Postman to use the Test Integrations and APIs default proxy port 3128 on the machine where the proxy is installed to redirect the requests.

Follow these steps to configure the proxy in Postman:

  1. Navigate to Settings -> Proxy.

  2. Enable the “Add a custom proxy configuration”.

  3. Provide these details:
    Proxy Server: IP address of the system where API proxy is installed.
    Port: 3128
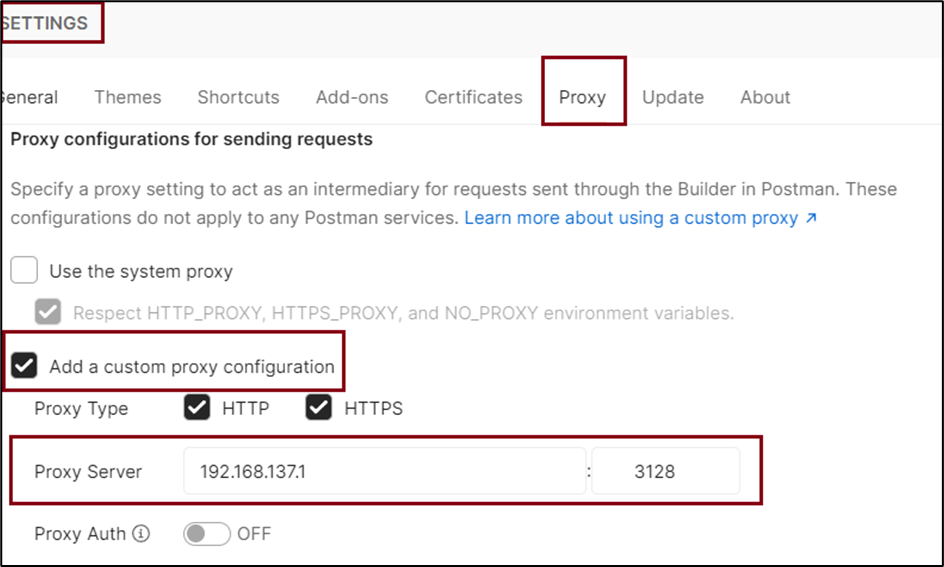

  4. Send the request in Postman and review the output versus the expected output.

Note: If you encounter an "Error: tunnelling socket could not be established, cause=connect ETIMEDOUT <ipAddress>:3128" error, then check that the correct IPv4 address is being used.

Check the IP and add the correct IP in Proxy Server

Recording SEND Request and RECEIVED Response Events

  1. Once the Integration is complete, open Test Integrations and APIs to configure and bind the HTTP connection in Architecture School. For Example:

    Logical View:

    Physical View:

  2. Navigate to the Recording Studio.

  3. Click the + icon to add the transport to monitor.

  4. Click the record icon to start recording.

  5. You may encounter a few errors during the recording process:

    a. No connected HTTPs agents: This error is typically caused by the unavailability of agent and proxy services.


    Check the status of the Agent and Proxy on the DevOps Test Control Panel server under the Infrastructure tab:


    Restart the Agent and Proxy services via the windows services section.

    Check the status again:


    b. Authorization Failed: This error indicates that the user is unable to access the proxy services bundled with DevOps Test Control Panel due to a 401 error. This usually occurs when domain-level security has already been configured in DevOps Test Control Panel.

     
    Navigate to Project -> Project Settings (a Project Logon pop up will appear)-> Provide the Username and Password -> check the “Logon as project administrator” box -> Ok


    c. Action Forbidden: This error indicates that Domain-Level Security (DLS) is enabled, and you have not granted the user permission.


    Go to Administration -> Domains and Environment -> Select Domain -> Users -> Add users to domain -> Save:


  6. Start the recording by clicking on the record icon.

  7. Open Postman and send the request.

  8. After sending the request from Postman, verify that you received the expected response.


  9. Once the response is received, return to Test Integrations and APIs and stop the recording. You will see the captured events in Test Integrations and APIs.

Creating a Test from Recorded Events

  1. To create a test from the recorded events, select the events and click on the test icon.

  2. Choose the test based on your requirements. A new test will be created under the selected component in the Test Factory.


    To learn more about creating tests, please refer to the product documentation.

  3. Run the test to verify the SENT/RECEIVED data.


  4. When you send a request, the request must be handled by the virtualized service (“Stub”). You must create a stub using the newly created operation (echo_wsdl in the example)

  5. Configure the stub, save and run it.

  6. The Test Lab perspective Console window shows the progress of the stub's startup and displays messages from the stub as it runs. Once initiated, the stub will begin listening on its designated queues and ports. If the log level for the stub is set to Debug, you will be able to see detailed information about the stub's activities.

    Now, you can either send the request from Postman or execute the preconfigured test to virtualize the call.


    Test Integrations and APIs indicates that the stub successfully received and processed the request from Postman.

Note: The stub will run for only five minutes, unless the associated test scenario requires a longer duration, with a limit of 1 transaction per second (TPS). After five minutes, the stub will automatically be cancelled.

Virtualizing Requests in IBM DevOps Test Control Panel (DevOps Test Control Panel)

To leverage the availability of the virtualized entity (Stub) for longer period, you can publish it to DevOps Test Control Panel, which allows additional control and monitoring tasks to be configured.

  1. Stop the stub on Test Integrations and APIs workbench and deploy the stub on the IBM DevOps Test Control Panel and virtualize the received calls.

  2. Right-click on the created stub and select "Publish Stubs" in DevOps Test Control Panel.

  3. Open DevOps Test Control Panel in a web browser and navigate to the Environment tab.

  4. You will see that the stub has been successfully deployed on DevOps Test Control Panel.

  5. Start the stub and wait for it to reach the RUNNING state.


  6. Like the Test Integrations and APIs Workbench, you can either send a request from Postman or execute the pre-configured test. In both cases, the DevOps Test Control Panel will receive the request at the stub and respond with the expected data.


Additionally, if the live systems are not operational, you can use a live endpoint, which is a dynamically allocated socket port assigned when the stub starts. This endpoint enables traffic to be routed even if the standard reverse or forward proxy ports are not configured.

  • After starting the stub, go to the Network Dashboard and copy the Recipient Details. 


  • Paste the details into Postman and send the request.


  • Check the Stub Hit Count and the statistics for the calls received and virtualized.


Conclusion:

Now that you know how a virtualized service (rather than a micro service entity) can be constructed with help of Test Integrations and APIs, you can learn and apply the skills in the DevOps culture. For more information about various functionalities and offering, refer to the Test Integrations and APIs product documentation.

    0 comments
    25 views

    Permalink