Number of Liberty JVMs affect throughput and memory footprint
Introduction
There are many factors that can cause performance issues in an application server environment. Changes to application code, an increase in the client load, and other environmental factors can put a strain on resources, reducing the ability of the application to respond to the client. Even if everything is seemingly running fine, there could be enhancements to make the environment run even more efficiently. This blog will focus on an aspect of performance tuning that can help improve throughput and use limited resources in a better fashion.
Experiment
Will one JVM using all of the cores on the system perform best? Maybe several JVMs, all with one core? Or something in-between? How does memory allocation affect throughput? The simplest ways are to add more memory to the heap and allocate more CPUs to the JVM. There are other parameters that can be played with (connections, threads, etc.), but we will focus on memory and CPU allocation.
Environment
These experiments were run on a 24 core system. I used taskset -c to allocate CPUs to the Liberty JVMs. The application used to test was a very simple ping-type application involving a single REST endpoint. I used the Semeru Java 8 runtime for my JVMs. Heap size per server instance varied such that the total heap setting would be equivalent between runs. Similarly, the number of cores allocated per JVM varied so all cores on the system are in use. For the client load, I used 12 processes, each running 4 threads, for a total of 48 threads hitting the REST endpoint across the varying number of JVMs in the experiment.
NOTE: Eclipse Openj9 was enhanced in the past to efficiently parallelize garbage collection operations. See https://blog.openj9.org/2019/12/19/dynamic-threads-for-scavenger-gc/ for more details. This allows throughput to be higher with a low number of JVMs.
Results
All results are server-side measurements. The client-side remained unchanged. Throughput is in requests/second, and memory is the actual footprint held in RAM, also known as resident set size (rss), in megabytes.
|
Number of JVMs
|
Number of cores per JVM
|
Max Heap per JVM
|
Aggregate throughput
|
Aggregate memory footprint
|
|
1
|
24
|
1536
|
164199
|
145
|
|
2
|
12
|
768
|
313687
|
236
|
|
3
|
8
|
512
|
401109
|
356
|
|
4
|
6
|
384
|
472249
|
445
|
|
6
|
4
|
256
|
490804
|
613
|
|
12
|
2
|
128
|
435195
|
1212
|
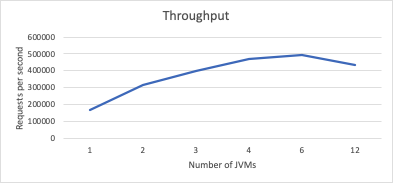
 This first chart shows throughput as a function of the number of JVMs. Recall that for all of these measurements, we are allocating the same number of cores and heap space to the JVM set. As you can see, after 4 JVMs, the throughput really starts to flatten out, even dropping off between 6 and 12 JVMs.
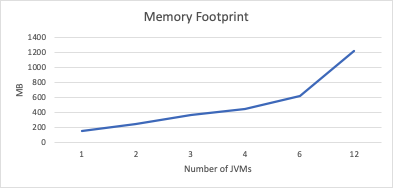
 The second chart shows the increase in memory footprint is very linear as a function of the number of JVMs. Recall the total maximum heap allocated to the JVM set is 1536 MB. It is logical that adding a new JVM increases the overall memory footprint on our system, as each freshly-started JVM will have the same amount of overhead.
Conclusion
What did we learn? In our case, we started with 1 JVM hosting our application. Without changing the client load, we varied the amount of JVMs and found that increasing the number to 4 produced a 188% increase in throughput. The tradeoff in this case was a mere 300 MB of footprint on our system. As we moved up to 6 JVMs, the gains really dropped off. We did see a 4% increase in throughput, but at a cost of 168 MB.
The fewer JVMs running, the more load flows through each instance. This leads to more threads per JVM, causing a greater likelihood of lock bottlenecking. The contention could be in the application itself, the application server, or the JVM. I won’t address the causes of potential bottlenecks, as the point of this blog post is to highlight how running multiple JVMs can have an effect on any bottleneck, no matter which layer it is in.
But as we grow our JVM set, we will see basic Java structures being duplicated in the separate heaps like Strings, System, framework initialization classes, and Liberty infrastructure overhead. At the JVM level, there will be copies of classes, methods, GC threads and stacks, JIT compiled code, metadata associated with that compiled code, etc. Scaling out increases overall throughput since it can avoid the locking, but it comes at a cost of larger memory footprint. Multiple JVMs also will take longer to warm up multiple JITs, causing the system to take longer to ramp up to full performance. If you extrapolate this experiment out to a more complicated application, or in an environment that is more memory-constrained, those factors may lead to a different decision being made.
Take some time to test out these principles in your own environment. I’m sure you will see some surprising results that will lead to better performance for your Liberty applications. Stay tuned to the performance blog series for a future post where I dive more into scaling up versus scaling out considerations in your Liberty environment.
#performance#websphere-performance#java-performance