This report is part of a series. See .
Actions
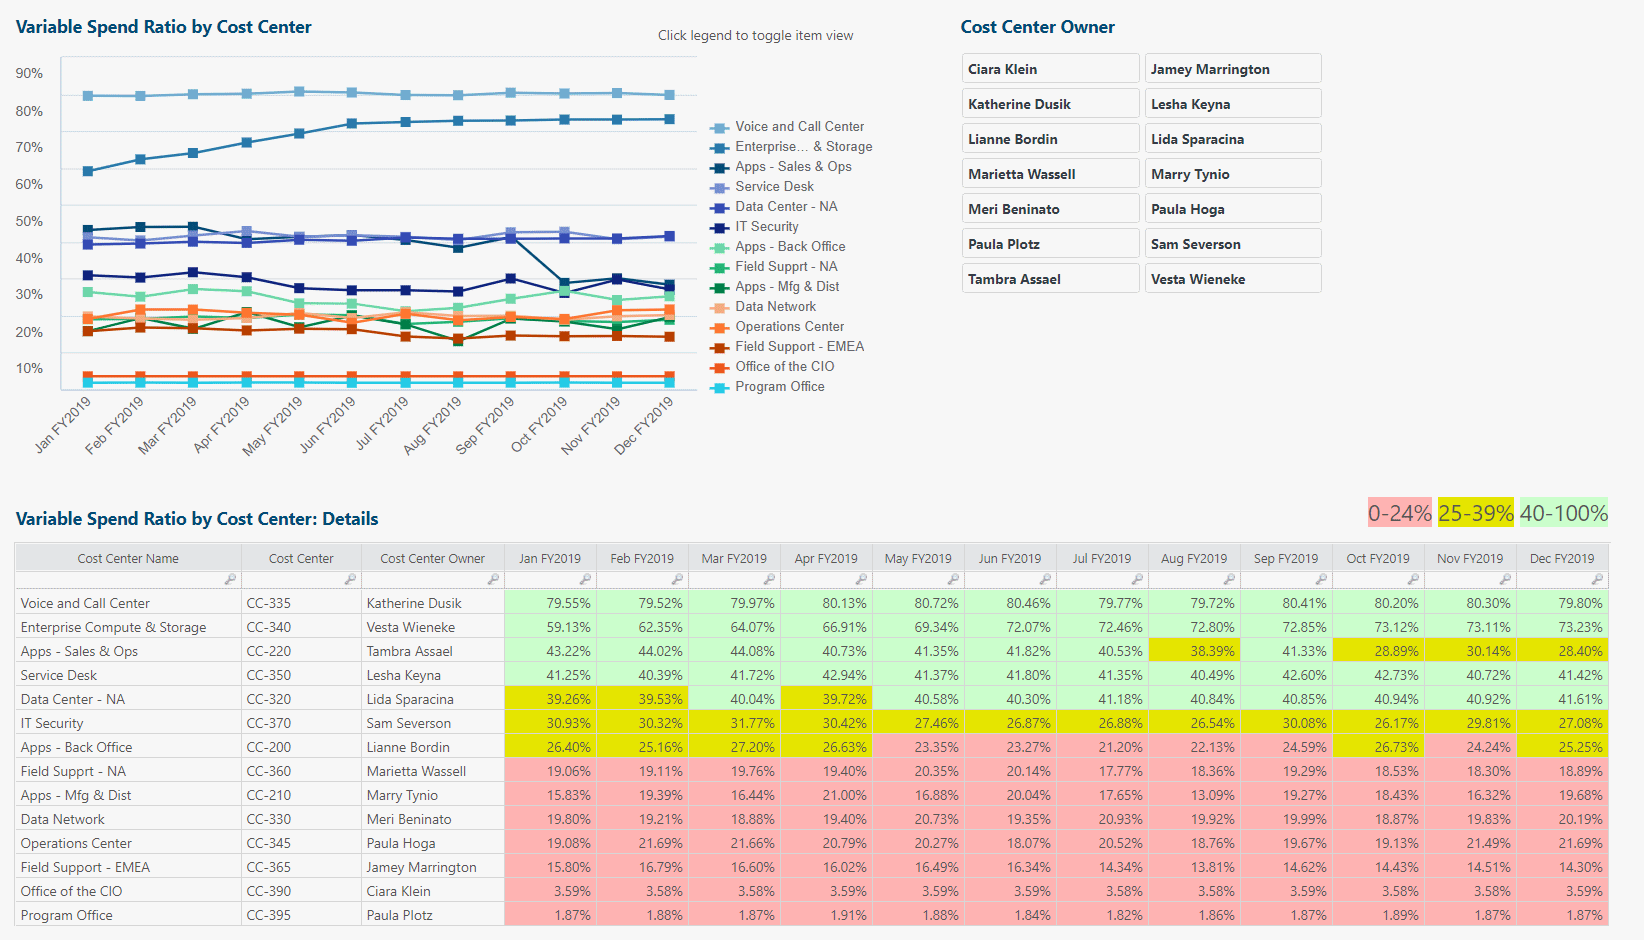
Cost centers with low variable spend ratio (VSR) could drag down overall IT agility, contributing to IT-facing and stakeholder-facing service quality stagnation.
Identify which cost center VSRs are low or trending downward. Determine target candidates for adjustment. Review all variable vs. fixed spend associated with target cost centers. In conjunction with cost center owners, decide how and by when to convert fixed operating expenses to variable expenses for each cost center.
Review this insight report monthly to gauge progress toward objectives.
Data
REQUIRED
Cost Source Master Data.Cost Center Name
Cost Source Master Data.Cost Center
Cost Source Master Data.Cost Center Owner
Variable (a metric)
Cost (a metric)
Build the report
BUILD DETAILS TABLE
(top) Ribbon > Report > Table.
(left) Project explorer > Tables > Cost Source > Cost Center Name: Drag to Rows area in ad hoc component configuration (AHCC) panel.
(left) Project explorer > Tables > Cost Source > Cost Center: Drag to Rows area in AHCC panel.
(left) Project explorer > Tables > Cost Source > Cost Center Owner: Drag to Rows area in AHCC panel.
(top) Ribbon > Data > Insert > Insert formula column:
Name: VSR
Enter formula: =Variable / Cost * 100
Format: Advanced: =NumberFormat({$_},"#,###.00")&"%"
(left) Project explorer > Time > Months (Yr): Drag to Columns area in AHCC panel.
(top) Ribbon > Data > Sum: Uncheck Show Total Row box.
Right-click table > Properties:
General > Name: Variable Spend Ratio by Cost Center: Details.
General > Show header: Check box.
Click to highlight the first of the 12 month-based columns in table (e.g. Jan FY2019).
(top) Ribbon > Data > Highlight: =If({$_}<25,"#FFB3B3", If({$_}<40,"#E6E600", "#CCFFCC"))
Click to highlight the second of the 12 month-based columns in table (e.g. Feb FY2019).
(top) Ribbon > Data > Highlight: =If({$_}<25,"#FFB3B3", If({$_}<40,"#E6E600", "#CCFFCC"))
Repeat above highlighting steps for the remaining 10 months. Only takes a minute.
Repeat above highlighting steps for any other fiscal years of interest (if any).
BUILD LINE CHART
Right-click on details table you just built > Copy to clipboard.
(bottom right) Report clipboard > Paste all.
Drag pasted table to any new location.
(top) Ribbon > Ad hoc > Line.
Right-click chart > Properties:
General > Name: Variable Spend Ratio by Cost Center
Chart > Legend location: East
Data > Maximum rows: 9999
BUILD SLICER
(top) Ribbon > Report > Row slicer.
(left) Project explorer > Tables > Cost Source > Cost Center Owner: Drag to Slice By area in AHCC panel.
(top) Ribbon > Slicer > Vertical: 2 columns.
Right-click slicer > Properties:
General > Name: Cost Center Owner
General > Show header: Check box.
General > Show border: Uncheck box.
General > Show auto search filter: Uncheck box.
Drag to expand size of slicer to accommodate display of all values at once, if possible.
BUILD HELPER TEXT 1
(top) Ribbon > Report > HTML.
In Edit Content window, paste:
Click legend to toggle item view
BUILD HELPER TEXT 2
(top) Ribbon > Report > HTML.
In Edit Content window, paste:
<span style="font-size:large">
<span style="background-color:#FFB3B3">0-24%</span>
<span style="background-color:#E6E600">25-39%</span>
<span style="background-color:#CCFFCC">40-100%</span>
</span>