KPIs display numerical values on a visualization widget. This allows users to focus a report viewers attention on a specific metric value.
Requirements
Users can create KPIs using the following combinations:
| Requirement | Example |
|---|
- 1 metric
- 1 dimension*
- Date range
|  |
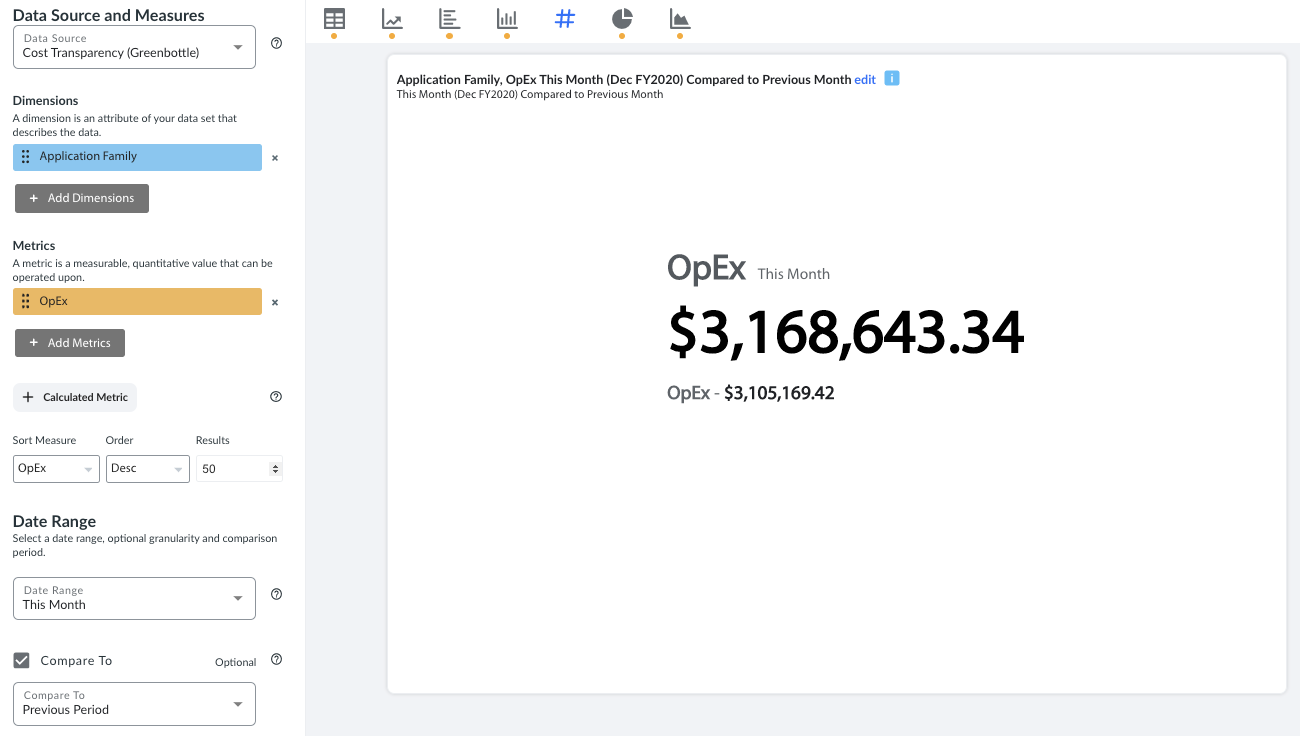
- 1 metric
- 1 dimension*
- Date range
- Compare To
|  |
- 2 metrics
- 1 dimension*
- Date range
|  |
* Set context for the KPI by selecting a dimension (hidden). For example, select an Applications dimension and OpEx to look at Applications total cost.
Options
The following are available visualization options that can be used to customize the look and feel of KPIs:
- Switch Metric
- Use this button to swap the primary and secondary metric on the KPI.
- Comparison Arrow
- Add a comparison arrow that will compare the primary and secondary metric.
- Shorten Metric(s)
- Use this toggle to shorthand the metrics
See alsoSample SSR visualizations for additional examples.
See also Create a self-service report for additional options for visualizations.