Authors: Eric Reid and James Sahler
eric.reid@ibm.com and sahlerj@ibm.com
IBM Z Engineering System Test
Introduction
Performance monitoring is a key component of managing sysplex integrity, detecting problems, and capacity planning. However, in a complex environment of multiple IBM Z machines, multiple DS8000s, switches, operating systems and applications, performance monitoring can quickly become a chore. In system test, we’ve had to log into many different systems, interfaces, and programs to analyze performance and detect problems in our environment. This proves a tedious and error-prone task.
We have implemented a simple solution for monitoring multiple Z’s, DS8000’s, and operating systems at once, using open source tools and API’s. This enables us to easily monitor how tests, code and other changes in our environment impact performance as a whole. In addition, by using these open source tools, they can be easily integrated into larger frameworks, such as Ansible automation, Slack channels, or webhooks. This discussion will go over the basics of our solution, how we use the dashboards, and how we’ve integrated it into other applications such as Slack and Flask webhook listeners.
Since our solution watches everything in our environment, we’ve nicknamed the solution “Sauron – the All-Seeing Eye”. The name Sauron will be used to describe the solution in its entirety. The entire setup process as described below took James about three weeks, starting from never having created an Ubuntu Linux VM to having Sauron operational, leading us to believe that this would be relatively simple to recreate in other environments.
Setting up Sauron from Scratch
We started from scratch, creating an Ubuntu server (we used 18.04.5, Bionic Beaver link: Ubuntu 18.04.5 LTS (Bionic Beaver), but see no reason it wouldn’t work at a newer level) in a Windows Hyper-V Virtual Machine. The packages used have support for a range of Linux operating systems. We chose this route because we had the available resources on the Windows Server to run Sauron, and room to expand. The virtual machine is very lightweight, though we don’t have many users of the Sauron tool; we allocated 2GB of RAM and 4 virtual processors to the VM. Storage requirements will vary based on how often data is collected from the target systems, how much is stored, and how many targets a user has. We have three DS8950’s, one DS8870, one z15, one z14 (grouped in one standalone zHMC) and at the moment one Linux operating system as targets.
Once Ubuntu was installed on the VM, we had to choose how to implement our monitoring. James tried OpenStack, but found the installation process very convoluted, and we decided to cut our losses and look for other solutions. Looking around, we found the joint solution of Grafana (Grafana link: Grafana® Features | Grafana Labs) and Prometheus (Prometheus link: Prometheus - Monitoring system & time series database), two open source tools, designed for tasks like performance monitoring. Grafana acts as a graphical dashboard to display data, it can display data from many different data sources. Prometheus is a time-series database, there are many options here but conveniently both of our major target groups, DS8000 and Z, had exporters built for them and publicly available.
We installed both of these programs on the Ubuntu VM, following the installation instructions provided by the Prometheus and Grafana teams. The next step was to get the data from the targets into Prometheus to be stored. This is done by “exporters” which are installed on the Ubuntu VM and configured to talk to target systems. DS8000 and Z had different paths to getting data into Prometheus and will be explained separately.
Z Prometheus Exporter
IBM Z data was of particular importance for Sauron due to some limitations of the native monitors in the zHMC/SE. We frequently ran into a problem where we wanted to look at historical Z performance data, but because we hadn’t started performance tracking in the zHMC, we didn’t have the data of hardware performance. However, IBM Z provides an API package with the zHMC code that enables applications to query performance data. This Redbook talks about these API’s, and how to enable them on a zHMC: SC27-2637-01. Another benefit of grabbing data from the zHMC is that all of the systems that are defined to a zHMC can be monitored with a single instance of the z-hmc-exporter, and the zHMC manages removing, adding, or modifying Z’s inside the sysplex. This removes the need for Sauron to deal with individual Z connections, or having to worry about making sure on install that Sauron is made aware of a new system.
Although these API’s are usable, we don’t have much experience coding REST applications, and it would take a long time to do for all of the varied monitors a Z system can have. Thankfully, a quick search uncovered the zhmc-prometheus-exporter (zhmc-prometheus-exporter link: 1. Introduction — IBM Z HMC Prometheus Exporter 0.7.0 documentation (zhmc-prometheus-exporter.readthedocs.io)), a Python-written exporter that automatically calls all the performance monitoring REST API’s from the zHMC and exports them to Prometheus for storing. A quick Python 3 install (Python install: 2. Using Python on Unix platforms — Python 3.9.6 documentation), and we had a zHMC exporter installed on the Ubuntu VM.
For security, this requires downloading and editing HMC credentials .yaml file, where the user ID, certificate, and any other security information that is set up when you enable a user to perform API calls in the zHMC (see the Redbook at the beginning of this section) requires. Additionally, the metrics.yaml file can be edited to filter what resources should and shouldn’t be included in the Prometheus scrape. We decided to go simple and keep all the resources to monitor, in case we need something later. Filtering is also very easy to perform in Grafana and can be done dynamically.
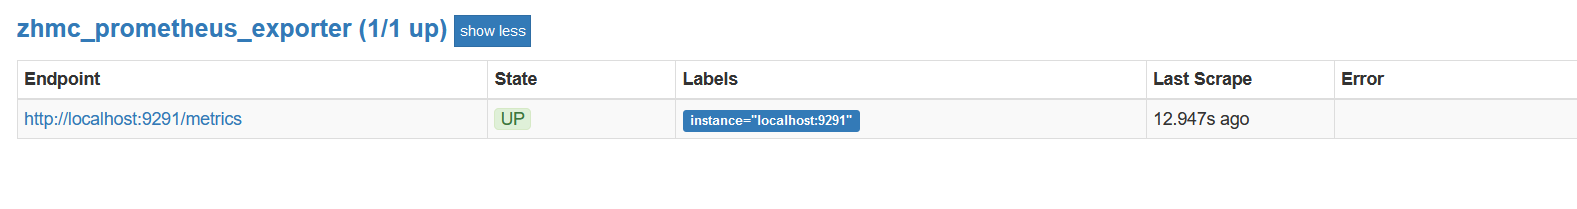
Currently, we manually run this command in a Linux screen (Linux screen: How To Use Linux Screen | Linuxize) whenever we reboot the VM, however this would be very easy to build into a system service using something like Supervisor (Supervisor: Supervisor: A Process Control System — Supervisor 4.2.2 documentation (supervisord.org)). Finally, in the Prometheus prometheus.yml file, we added the port that the zhmc-prometheus-exporter sends the data too, enabling Prometheus to grab the data and store it in the time-series database. In Prometheus the target can be verified:
Setting up DS8000 and Switch Monitoring
DS8000’s and switches can be monitored from IBM Spectrum Control or Spectrum Insights (Spectrum Control: IBM Spectrum Control - Overview | IBM and Spectrum Insights: IBM Storage Insights - Overview | IBM). Both products allow for many storage devices and switches to be added to them for monitoring and management, Control generally runs on a user-provided server, Insights is cloud based. In addition, both products can monitor non-IBM SAN hardware, increasing the scope of Sauron’s monitoring capabilities. This broad feature set will be used to monitor the rest of the SAN that our Z’s are attached to. However, we want to be able to see all this data in Sauron alongside Z data, so another step is needed. We found Redbook REDP-5418-00 about using Grafana with Spectrum Scale and figured that something similar may exist for Spectrum Control, which we already had installed and running.
James found the ibm-spectrum-exporter (IBM Spectrum Exporter: GitHub - topine/ibm-spectrum-exporter: Prometheus Exporter for IBM Spectrum Control), which is a Docker-based image of an IBM Spectrum performance exporter. We installed Docker on our Linux VM (Docker: Get Docker | Docker Documentation) and grabbed the ibm-spectrum-exporter image. We didn’t make any changes to the Docker image, so the packaged metrics.yaml file is set to collect all data it can. There are many other Spectrum exporters depending on which type of Spectrum you are running, and other requirements you may have, however this exporter worked well for us. Like the z-hmc-exporter, we initialize the Docker container with a manual command on a reboot of the VM with the command suggested in the documentation, this could also be automated with a program like Supervisor.
Finally, we add the port for the ibm-spectrum-exporter to Prometheus and verify that it is scrapping the data correctly:

Connecting Grafana to Prometheus and Other Setup Notes
At this point Prometheus is connected to the zHMC and Spectrum Control exporters, and should be storing performance data into its time-series database. If you want, you can configure additional exporters from operating systems, other management and monitoring software, etc. A great example is from Broadcom of using Zowe and CA SYSVIEW to export data to a Prometheus instance from zOS and Db2 (Broadcom example: Prometheus and Grafana Integration (broadcom.com)). You can always add targets later to Prometheus, the link from Prometheus to Grafana is target independent. A large organization will likely also want to set up user accounts in the Grafana configuration for security purposes.
Finally, you need to follow the Grafana install and setup guide (link at the beginning of this document) to configure your data sources, in this case it should be the Prometheus data source. With this, you can start building dashboards, notifications, and other monitoring capabilities. Grafana has excellent tutorials on how to set up different dashboards, views and graphs. Here is an example graph of all of our CHIPD activity across both of our Z’s: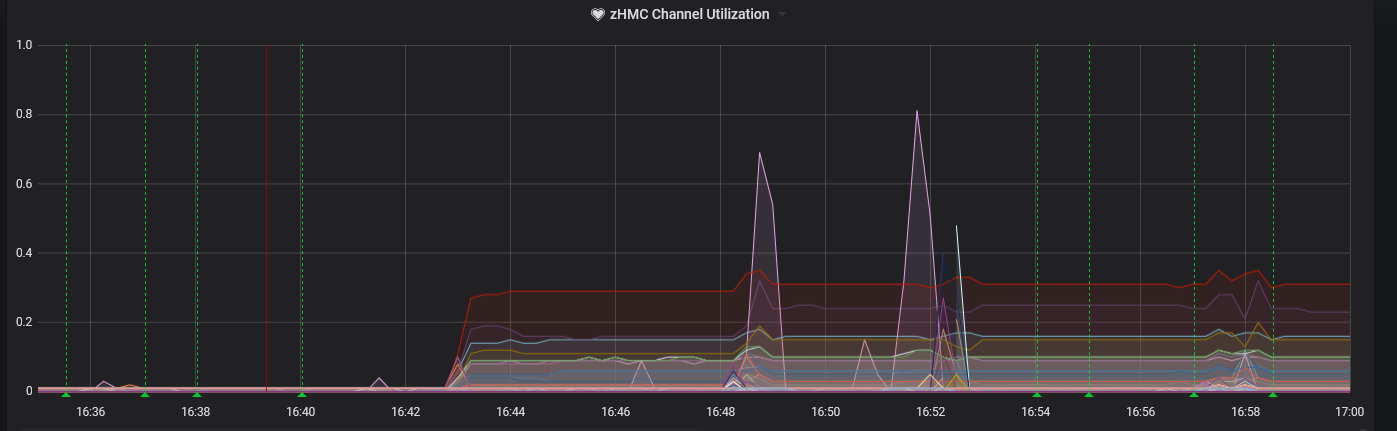
And a graph of the average total I/O rate across all of our DS8000’s at once, which has proven useful for us for capacity management and workload balancing: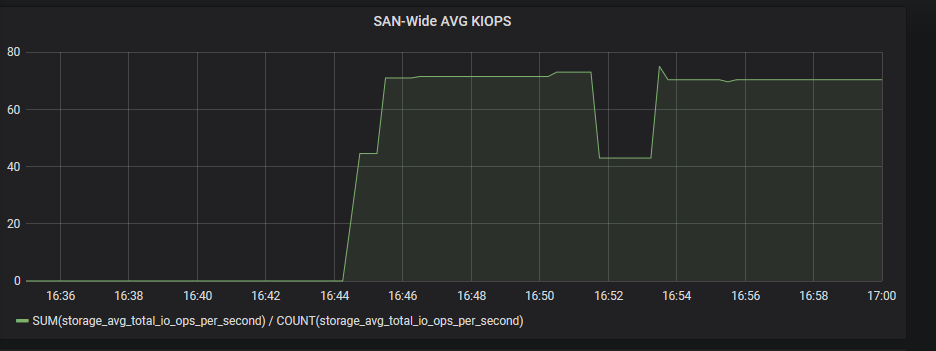
Using Sauron for Good
Now that we have set up Sauron and have all this data, a logical question is what other functionality is useful in an enterprise environment? The good thing about being a solution build on open-source technology is that Sauron is very flexible, and can interact with all sorts of monitoring, logging, control and management software such as the ELK stack, Open Stack, Ansible, and test suites like Galasa. We’ll give a couple of examples of some simple things we do in our environment that enables Sauron to truly act as our watchdog of the environment, alerting us of problems and recording historical problems.
Setting up Alerts
Grafana can monitor for changes in performance and issue alerts to a user. To set up an alert, edit a dashboard and click the bell icon in the bottom left hand corner. This enables the use of queries on the data to trigger alerts. We use this to look for drastic (over a 30% change after a 5 minute delay period) changes in CHIPD activity in the example below: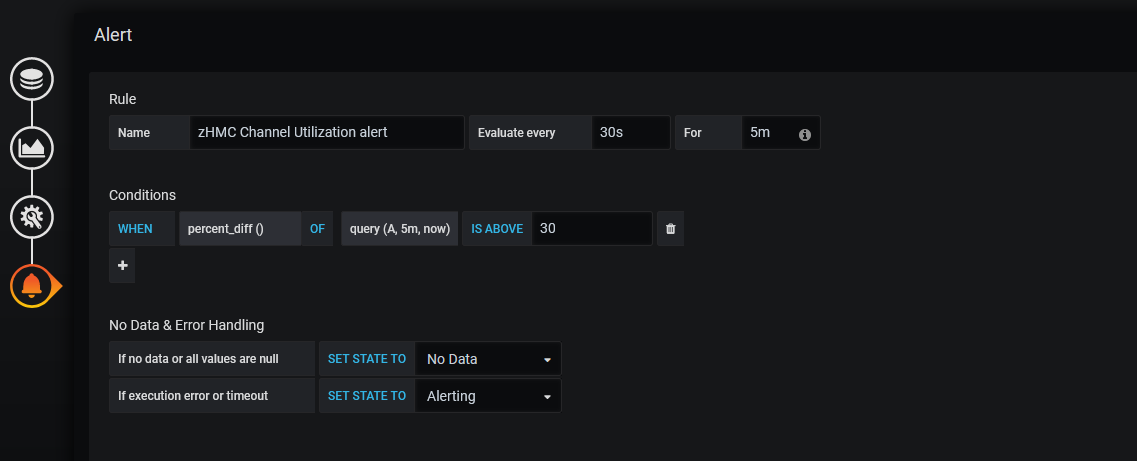
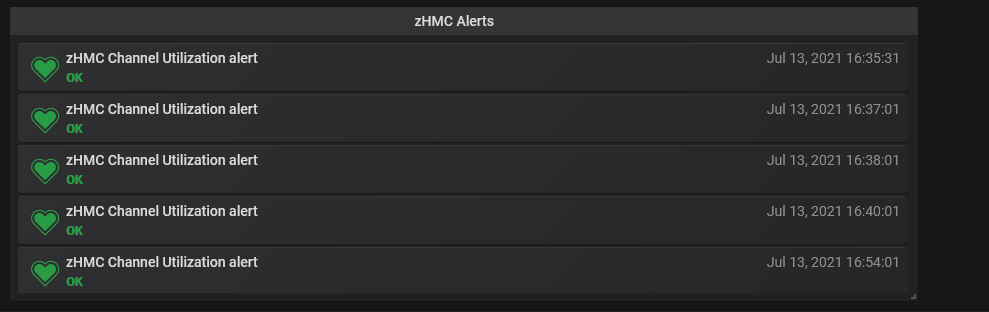
The alerts can be piped to a separate log panel of a dashboard, which will show alerts that resolved themselves before the 5min wait time with a green heart, and ones that didn’t with a red heart, indicating an alert was actually issued:
This can be a great way to have everything in one page, with usage and performance statistics, alert dashboards and other summaries all on a single dashboard across the environment. Grafana enable you to build custom dashboards that can drill into specific parts of your environment from the same interface, so problems can be identified on a macro scale, then drilled into specific ports, CHIPDs, host adapters, etc.
Notifications and Connecting Grafana to a Framework
Although alerts are a great start, Grafana can go one step further in problem detection with the notifications channel feature. In the Alerting menu, there is a page for Notification channels. Grafana includes a wide range of configurable notification options, including Slack, webhooks, email and Discord. These notification channels are very easy to configure, and by turning on the “Disable Resolve Message” feature, only alerts that did not get resolved will be sent to a notification channel. A Slack notification for our alert can look like:
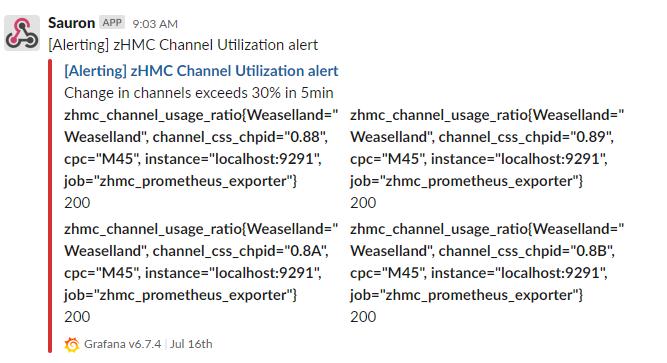
Grafana can also send different alerts to different notification channels, enabling a truly unique reporting and alerting infrastructure. We’ve also set up webhooks to custom-built Flask applications running tools to grab system data when alerts are issued. The same alert, that a channel has a drastic change in performance, triggers both a Slack notification and a webhook in our environment, showing the versatility of Grafana’s integration.
Conclusion
We have found Sauron to be an invaluable aid in monitoring our environment during testing, as well as for capacity management and workload balancing. It’s a simple set of tools, relying heavily on open-source solutions to achieve its goals. Many of the open-source components can also be purchased or run on a managed cloud-server, if a user doesn’t want to deal with the installation, setup, or management of the services. Our hope is that this example can help users develop their own full-environment monitoring solutions.
#Highlights-home#Highlights