IBM Elastic Storage Server users are allow to use 3rd Party performance visualization tools to access the internal ESS performance data. This functionality is provided by the IBM Spectrum Scale Monitoring Bridge. With IBM Spectrum Scale Monitoring Bridge, users can visualize ESS performance graphs using Grafana dashboard.
1. How Grafana collects statistic ESS performance dataThe IBM Spectrum Scale Performance Monitoring Bridge translates the performance data collected by the IBM Spectrum Scale Performance Monitoring tool to the data organizations and query requests used by openTSDB. ESS cluster has Spectrum Scale Performance Monitoring software ( pmsensors and pmcollector ) installed after deployment. Collector will collect performance data from ESS I/O nodes. To enable GNR VIO performance collection we need to run "mmperfmon config update GPFSVIO.period=1" command and restart pmsensors service "systemctl restart pmsensors" on all I/O nodes in ESS cluster.
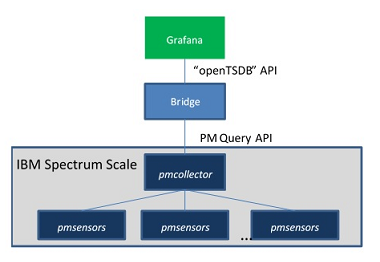
Figure 1, IBM ESS data collection framework for Grafana
2. Setup the Monitoring BridgeThe IBM Spectrum Scale Performance Monitoring Bridge needs Pyhon and CherryPy installed (CherryPy 4.0.0/Python 2.7 or CherryPy 14.0.1/Python3.6 for 3.1 release). Users can download the bridge package file "zimonGrafanaIntf.tar" and unpack the package. From the directory of zimonGrafanaIntf, start the bridge application by running command:
# python zimonGrafanaIntf.py –s <pmcollector host>
If bridge installed on pmcollector node in ESS cluster, command can skip the "-s" option to let the bridge find the pmcollector local query port 9084. If need remote connection, please make sure to configure the firewall to allow the network connection.
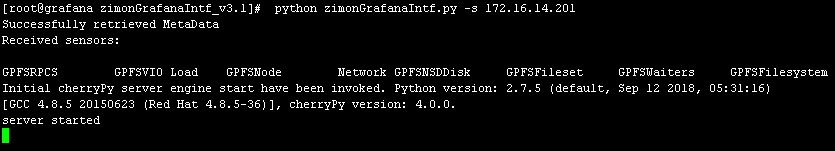
Figure 2, IBM Spectrum Scale Performance Monitoring Bridge Startup
3. Configure the GrafanaDownload the Grafana package from http://grafana.org. For example install the grafana-5.0.0.1-1.x86_64 rpm on RHEL x86 server, and start grafana server by "systemctl start grafana-server" command.
For RHEL system, the grafana configuration file is /etc/grafana/grafana.ini, configure the grafana as user's requirement. For example:
protocol = http
http_addr = 172.16.14.200
http_port = 3000
Each time change the grafana configuration, user needs to restart the grafana-server service.
Use web browser to open the link "http://172.16.14.200:3000" to login with default user name and password as "admin/admin" to the grafana main page.
Choose "Configuration -> Data Source", and click "add data source" to create new data source point to bridge server:
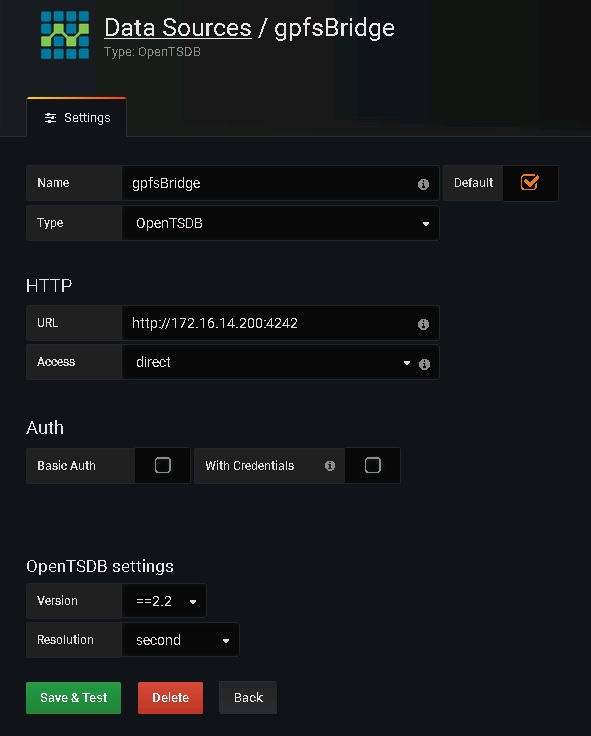
Figure 3. Grafana Data Source configuration.
4. ESS VIO performance monitoringAfter data source is configured and saved successfully, now user can add dash board to configure grafana to show ESS VIO performance.
From right up corner, select "add panel", then select "edit" from the panel drop list to edit the panel metrics.
Below are two examples to show gpfs_vio_readOps and gpfs_vio_FTWOps statistics for two I/O nodes in a ESS cluster. Please follow the example to configure the panel and don't forget to choose data source as the just added.
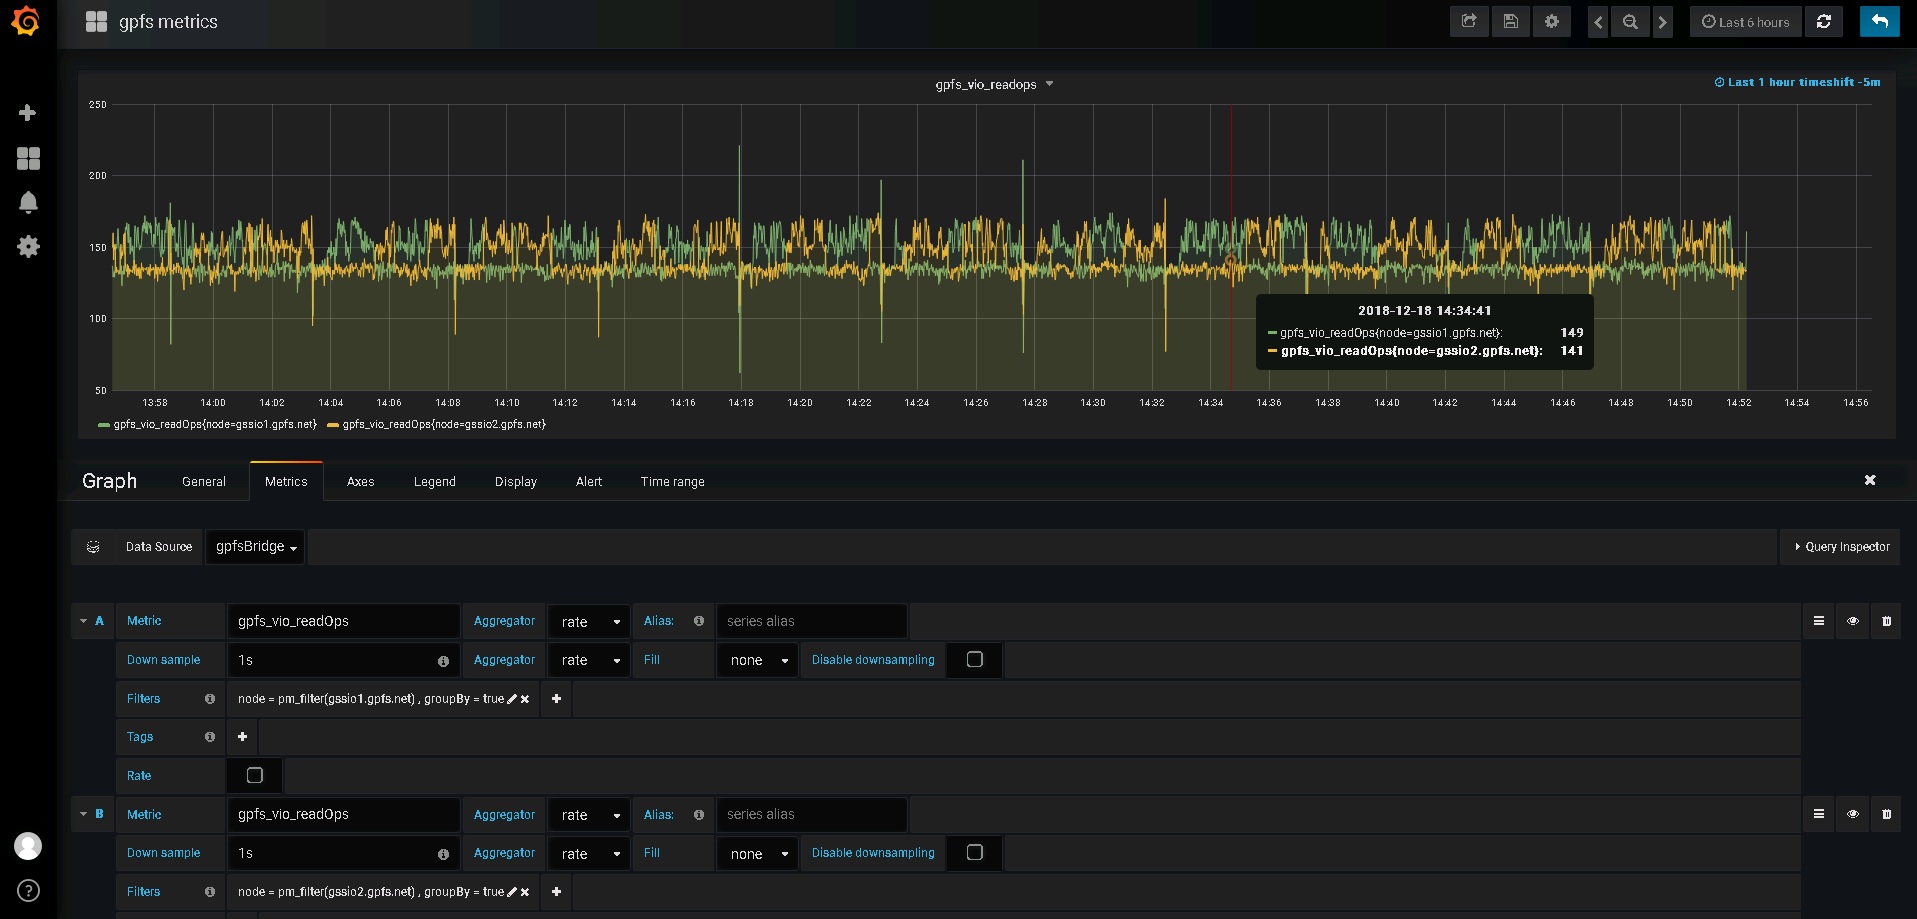
Figure 4, gpfs_vio_readOps
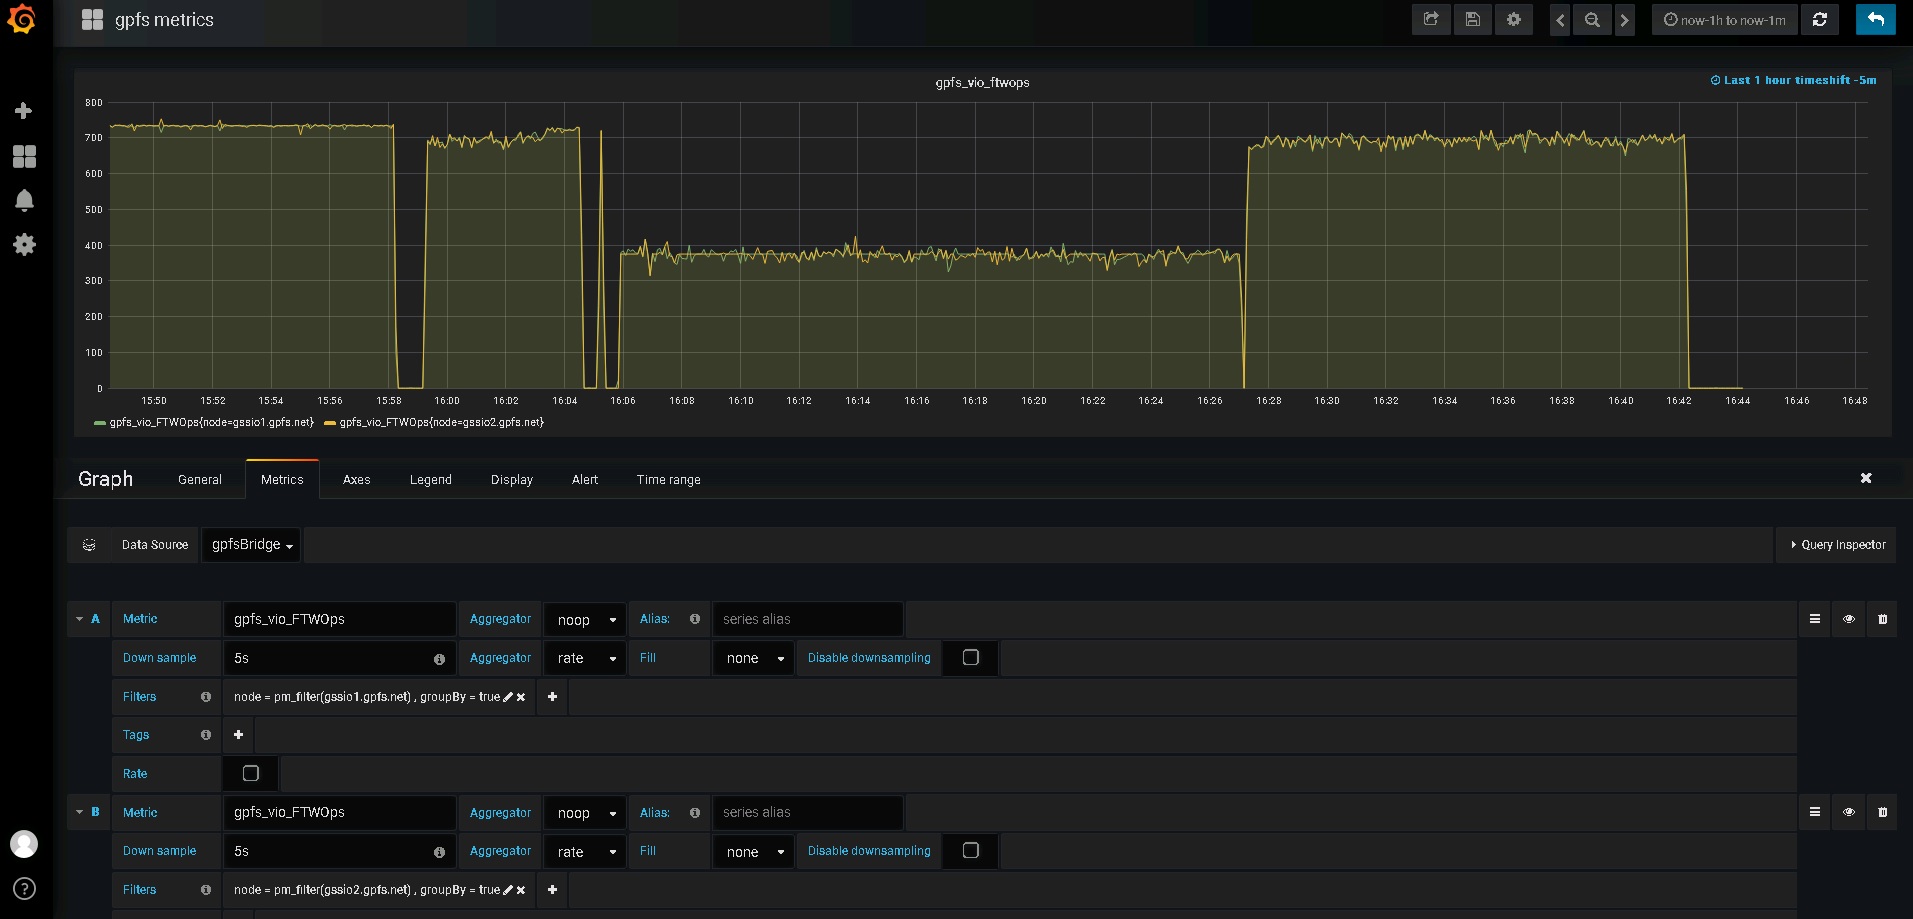
Figure 5. gpfs_vio_FTWOps
5. Reference
For more details about Grafana performance visualization with Spectrum Scale, please goes to
IBM Spectrum Scale Performance Monitoring Bridge.#ESSperformanceGrafana#Softwaredefinedstorage