The IBM Spectrum Scale™ 5.0.0 release introduces several new features in its GUI to improve the usability and consumability of the product. The major capabilities that are introduced in this release are explained in the following sections of this blog.
Monitoring networks
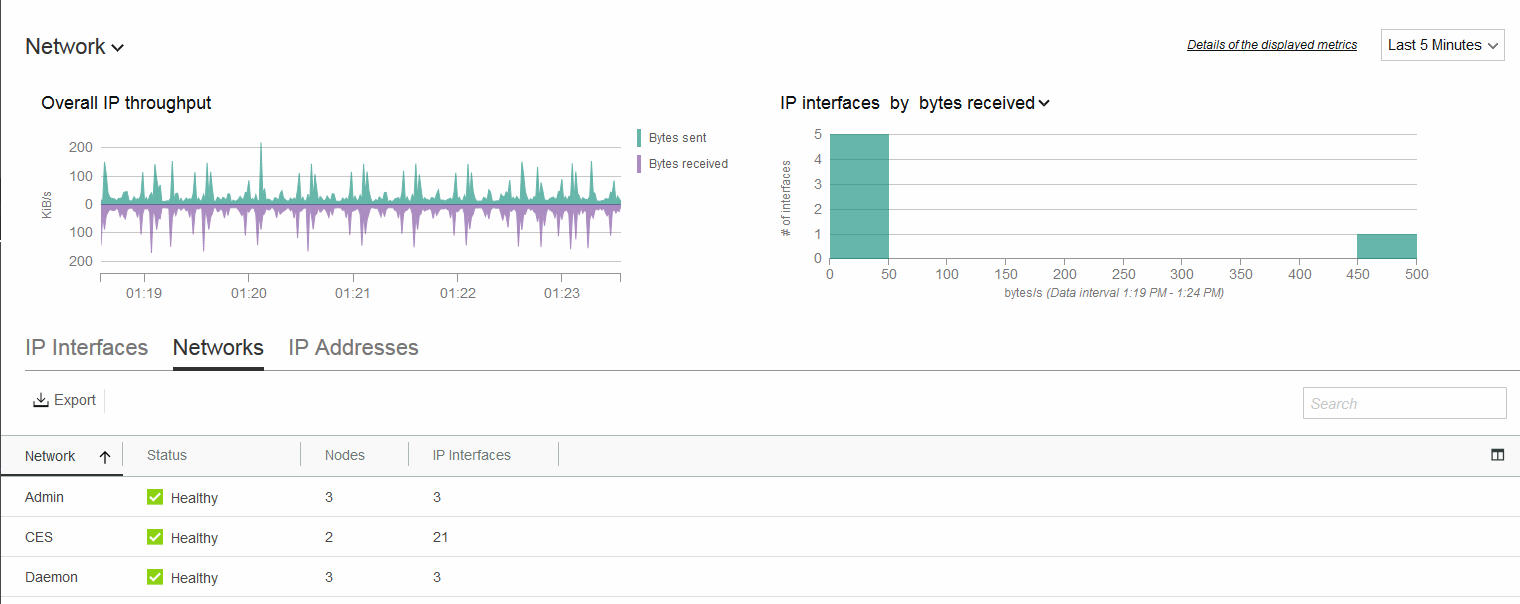
A new Network page is added to monitor the performance and health aspects of network configurations in the cluster. You can monitor the network performance with respect to the IP and RDMA interfaces that are used in the configuration. For more information, see
Figure 1. Networks page in the IBM Spectrum Scale GUI
Configuring and monitoring system thresholds
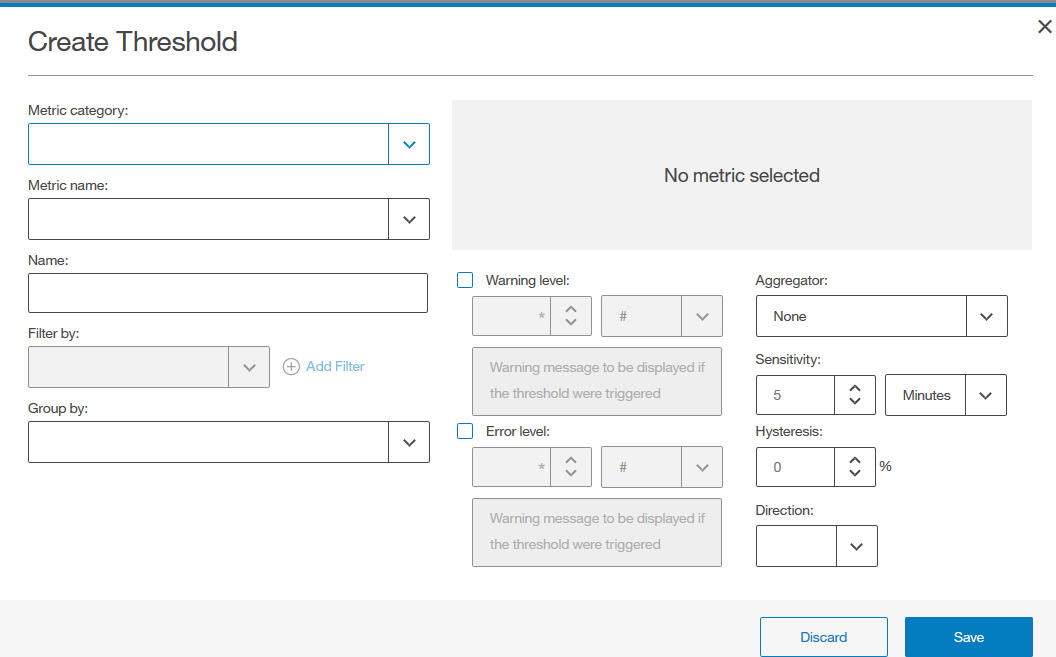
You can configure the IBM Spectrum Scale™ to raise events when certain thresholds are reached. You can use the newly added Monitoring > Thresholds GUI page or the mmhealth command to define or modify thresholds for the data that is collected through
the performance monitoring sensors. For more information, see Monitoring thresholds.
Figure 2. Create Threshold dialog
Creating a file system
The file system creation capability is added in the GUI. You can now use the Files > File Systems > Create File System option to launch the Create File System wizard.
Figure 3. Create File System wizard
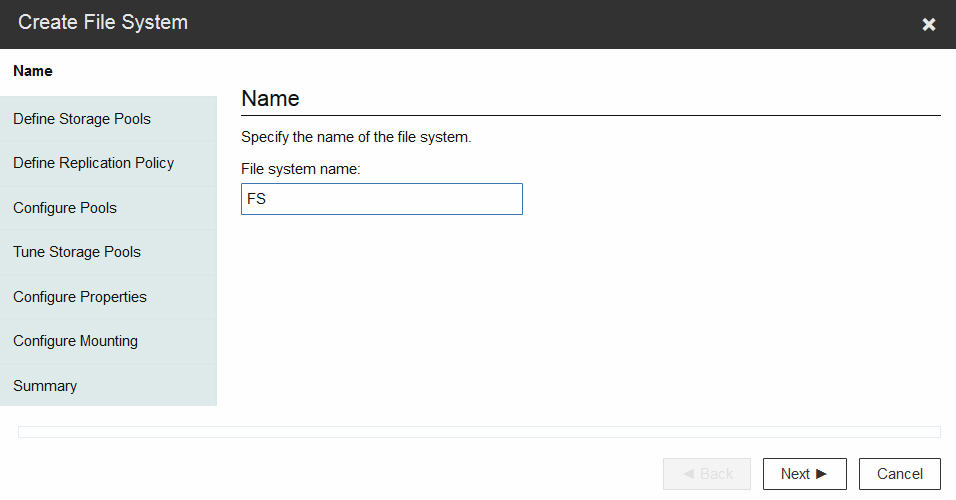
In the Create File System wizard, you can specify the following details while creating a file system:
- File system name
- Storage pools
- NSDs for the storage pools
- Failure groups
- Replication policy for data and metadata
- NSD order for data writes
- Inode size and block size
- Maximum number of Spectrum Scale clients
- Maximum number of inodes of the root fileset
- Whether to enable quota and scope for the quota definition
- Whether to enable DMAPI
- File system format version
- Mount point and automatic mount mode
- Nodes on which the file system is automatically mounted
For more information, see
Configuring call home
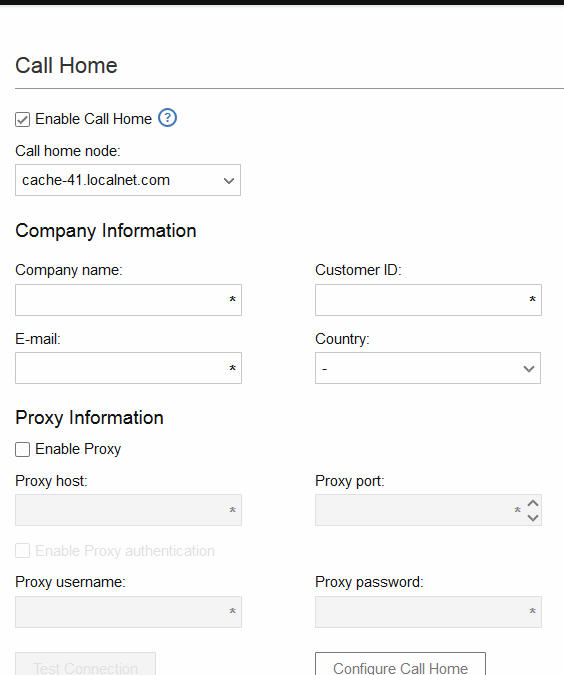
A new Settings > Call Home page is introduced to configure call home through GUI. Configuring the call home feature helps the IBM® Support to monitor the system. Configuring call home also helps to reduce the response time of the IBM Support to resolve any issues.
Figure 5. Call home page in the GUI
Uploading diagnostic data to a PMR
The diagnostic data that is downloaded through the Settings > Diagnostic Data can be uploaded to a problem management record (PMR) by using the call home feature in the backend. This data can be used by the support personal to rectify the issues reported in the system. To upload the diagnostic data, right-click the relevant data set from the Previously Collected Diagnostic Data, and select Upload to PMR.
Improved transparent cloud tiering monitoring
The Files > Transparent Cloud Tiering page now displays the file systems and filesets that are mapped with the transparent cloud tiering services. It also shows the connection of such a container pair configuration to a cloud account and the corresponding cloud storage access point (CSAP) that is configured for the cloud account.
Support for new directed maintenance procedures
The directed maintenance procedures (DMPs) assist you to fix a problem when you select the action Run fix procedure on a selected event from the Monitoring > Events page. DMPs are present only for a few events that are reported in the system. For more information on the DMPs available in the GUI, see
AFM monitoring changes in the GUI
Active File Management (AFM) enables data sharing across clusters, even if the network is unreliable or has high latency. AFM requires that you create associations between IBM Spectrum Scale™ clusters, or between an IBM Spectrum Scale cluster and an NFS data source.
The Files > Active File Management page now lists the number of AFM filesets and the corresponding export server maps. Each export map establishes a mapping between the gateway node and the NFS host name to allow parallel data transfers from cache to home.
Figure 6. Active File Management page in the GUI
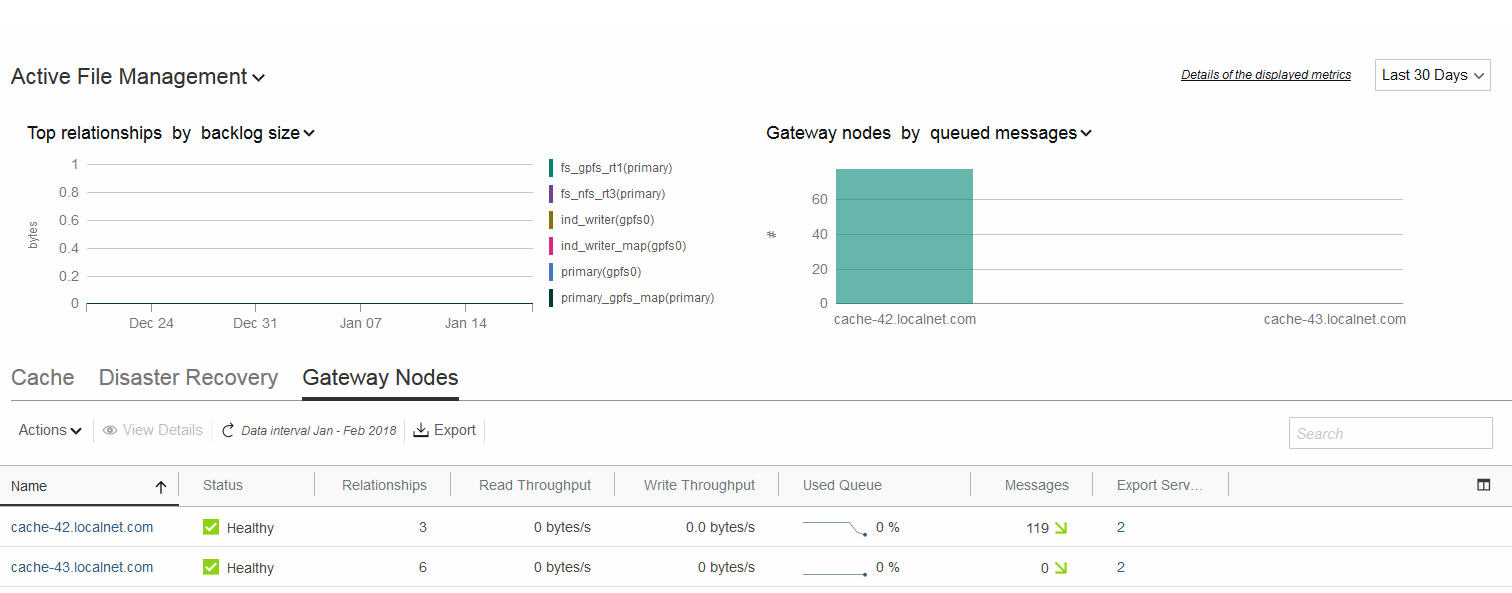
Monitoring remote cluster in AFM configuration
To monitor a remote cluster, the GUI node must establish a connection with the GUI node of the other cluster. By establishing a connection between GUI nodes, both the clusters can monitor the other cluster. You can use the newly added Access > Remote Connections page to establish a connection between the GUI node of the local cluster and the GUI node of the remote cluster.
Figure 4. Remote Connections page in the GUI
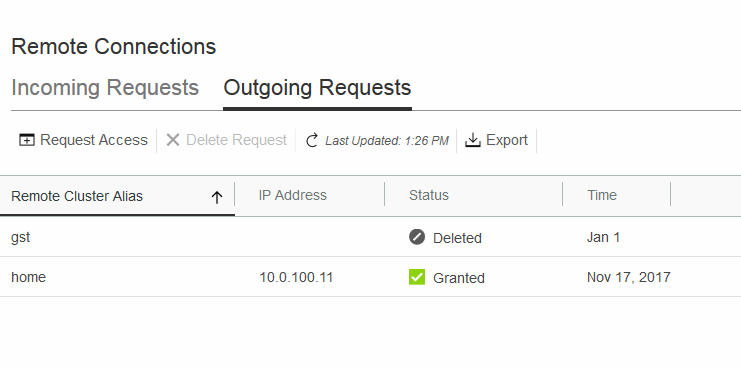
By using the Request Access option available in the Files > Active File Management or Access > Remote Connection page in the GUI, you can now establish connection with remote clusters. Only AFM remote monitoring is supported in the IBM Spectrum Scale 5.0.0 release. More remote cluster monitoring capabilities will be added in the future releases. After establishing the connection, you can monitor the following AFM and AFM DR configuration details across clusters:
- On home and secondary, you can see the AFM relationships configuration, health status, and performance values of the Cache and Disaster Recovery grids.
- On the Overview tab of the detailed view, the available home and secondary inodes are available.
- On the Overview tab of the detailed view, the details such as NFS throughput, IOPs, and latency details are available, if the protocol is NFS.
For more information on the newly added Remote Connections page, see
Creating AFM peer snapshots
You can use the Create Peer Snapshot option in the Files > Snapshots page to create peer snapshots. You can view and delete these peer snapshots from the Snapshots page and also from the detailed view of the Files > Active File Management page.
For more information on AFM and AFM DR configuration, see
Acknowledgement
Markus Rohwedder – IBM Spectrum Scale GUI architect
Stefan Roth – IBM Spectrum Scale GUI developer
#IBMSpectrumScale5.0.0#Softwaredefinedinfrastructure#IBMESS#IBMSpectrumScaleGUI#IBMSpectrumScale#Softwaredefinedstorage