The QRadar Deployment Intelligence (QDI) App, available on the IBM Security App Exchange, is an application to visualize, monitor and investigate the health and performance of your QRadar deployments all in one single view.
I’m going to outline a couple of the major components that this app offers to help you better understand the health of your QRadar deployment.
Deployment Overview
The deployment overview gives an aggregated view of the hosts of your QRadar deployments. With that said, when you collapse the Deployment Overview screen you will see other collapsible headers which denotes every single host in a deployment.
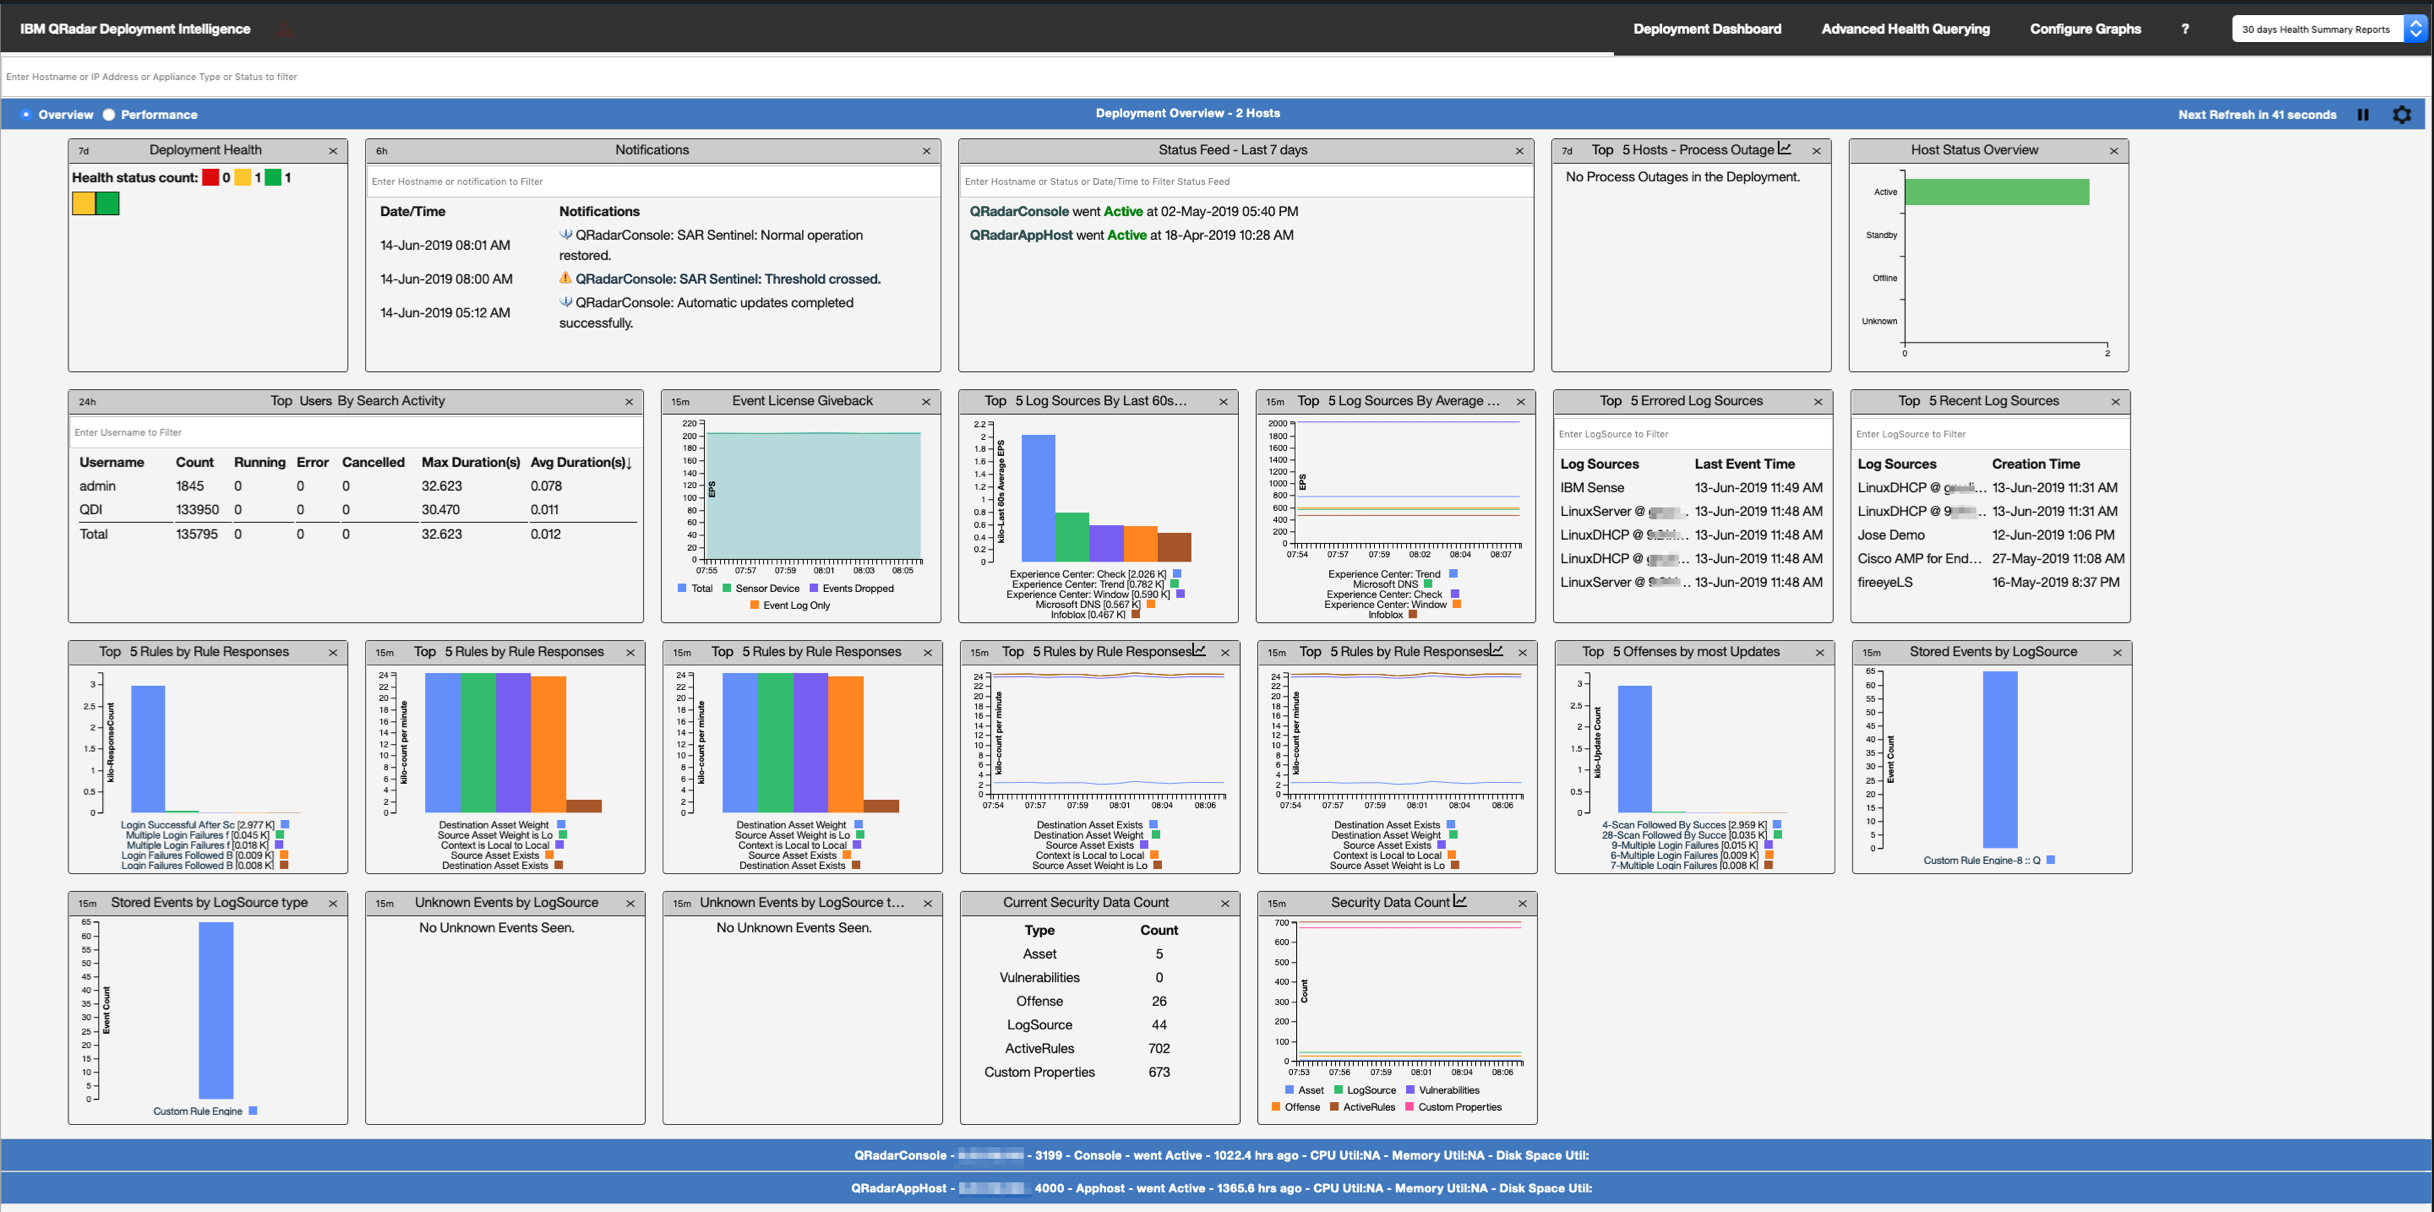
In the Deployment Overview, you will see several dashboard widgets for graphing various metrics:
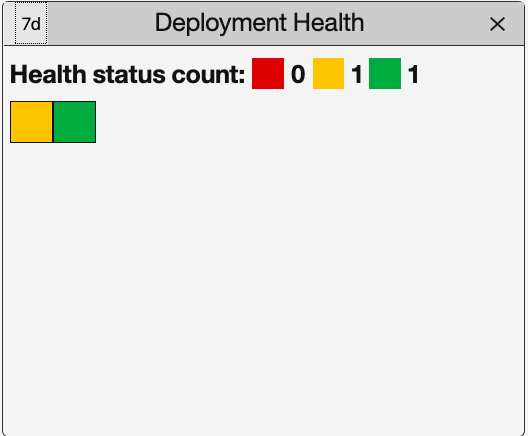 Deployment Health heat map
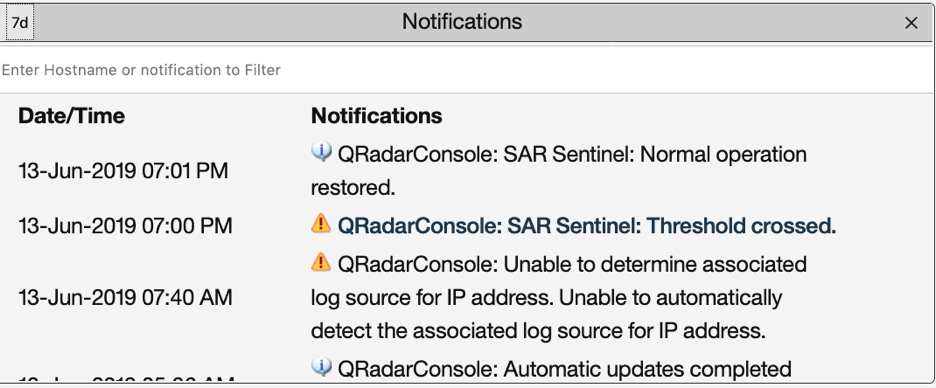 Notification Mapping
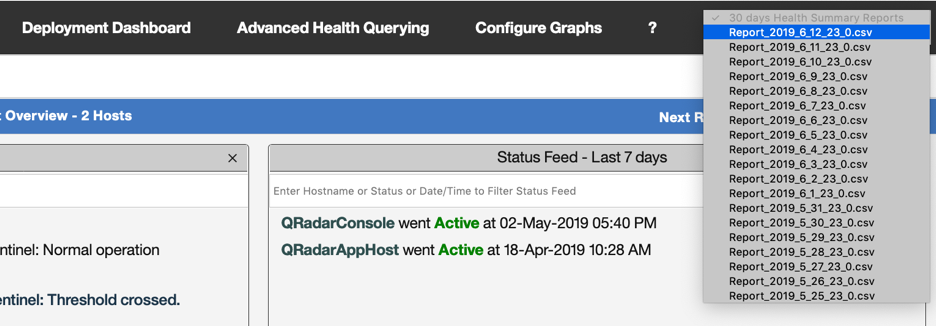
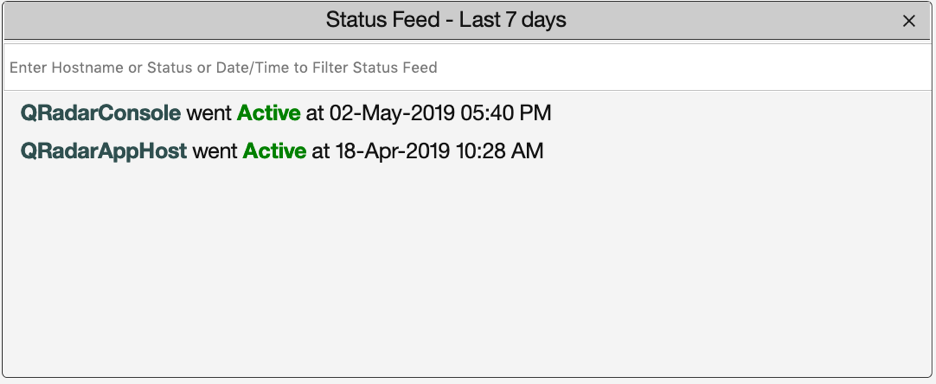 Status Feed
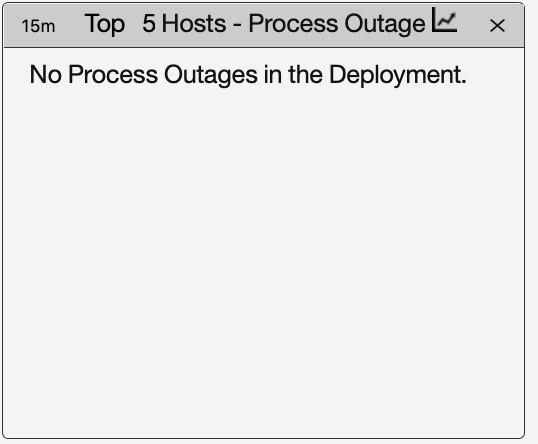 Component Status/Process Outage
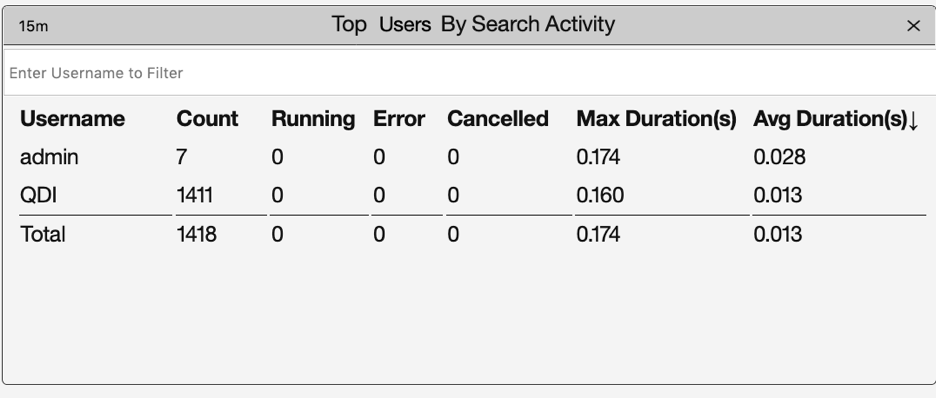
Search/API Activity
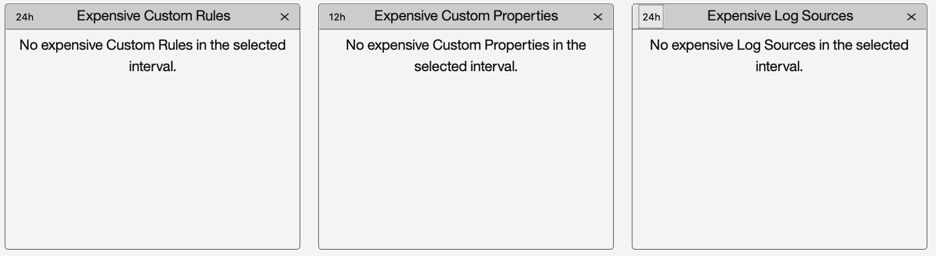 Expensive Security Data Artifacts [Rules, Offenses, Log Sources, Custom Event Properties]
Host Level View
The Host level view provides metrics associated to a particular QRadar Host.
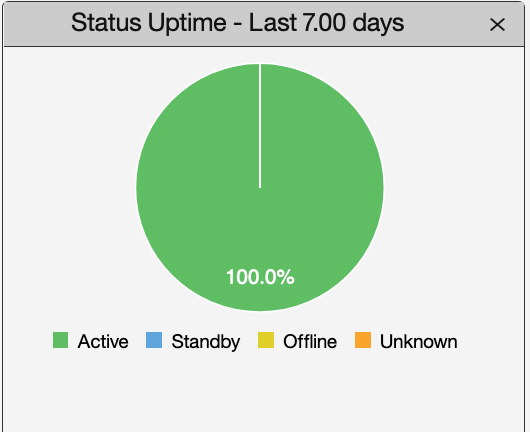 Status Uptime
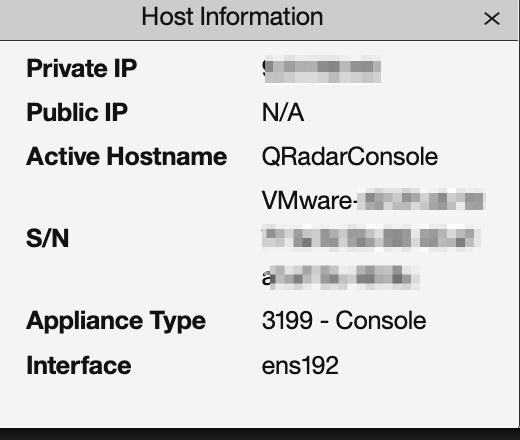 Host Information
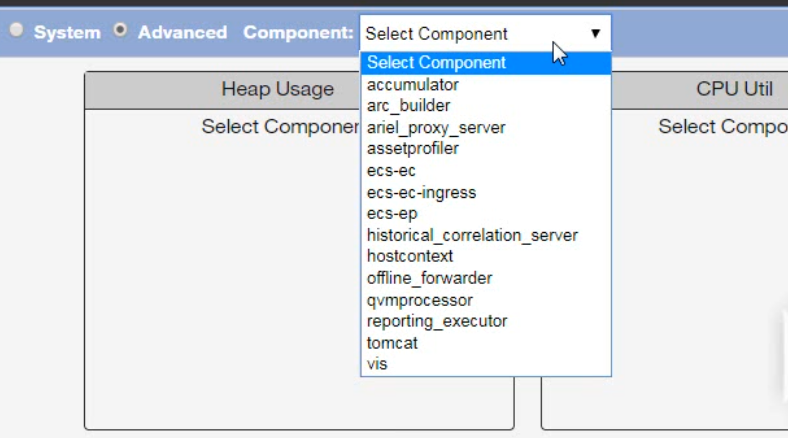
Host level Advanced view
This Host level Advanced view let’s you view metrics for a particular host. Once you’ve selected the component you want to view, it will start populating metrics for that particular host.
Advanced Health Querying
This lets you query health metrics of historical data. 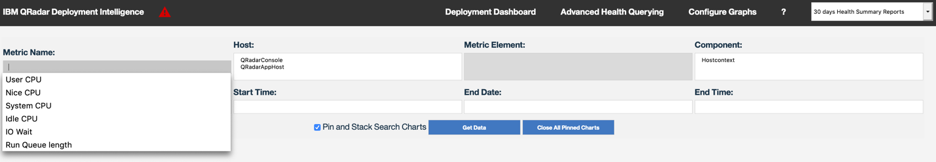
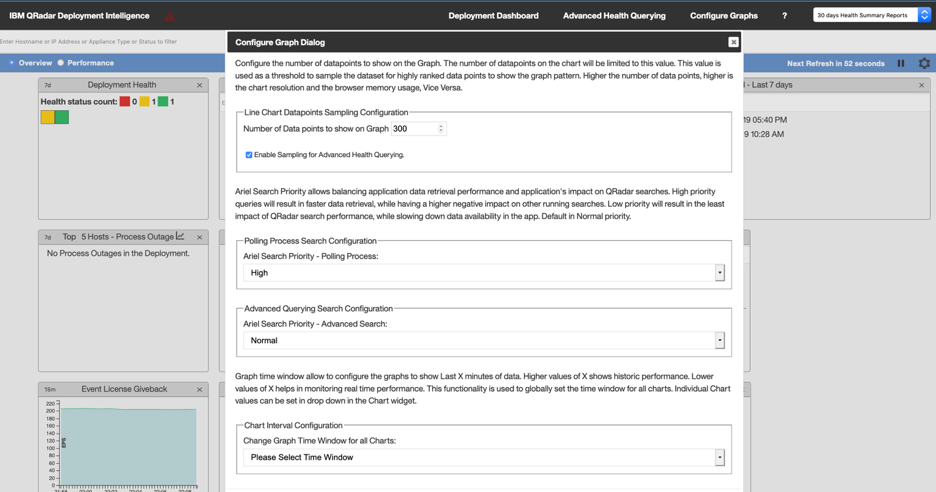
Configure Graphs
The QDI App offers the ability to configure the predefined graphs. All the line charts in the QDI App is shows 300 data points per line by default and increasing the data points offers better resolution. However, it will consume more memory in your processor and can possibly make the app slower.
Additionally, you can configure the time window in which you want to query the metrics of your deployment.
Reporting
This app generates reports of your defined QRadar metrics nightly for reporting purposes, such as the deployment health, the system health metric summary, top log sources and so on.
Next steps
If you’re interested in learning more about the health and performance of your QRadar Deployments and are keen on looking into the analysis of the result of your deployments and much more, I’d definitely recommend installing the QRadar Deployment Intelligence App.