Having worked in i2 since 2004, the customer challenges I enjoy the most are the ones that come out of left field. In this blog I will share with you a challenge I was recently presented from a Financial Services organization.
‘Can i2 be used for dependency management?’ This was the opening question from their Transformation Strategy & Planning team. (For those reading this who don’t know what dependency management is, it is broadly the reliance one deliverable has on the next.)
‘Why not?’ I thought in response to the question. After all, this is only the process of linking two or more items together that have an association with each other. This should be no more difficult than using i2 to model a flow of money, telephone calls, or events pertaining to a serious organized crime group.
As I explored this new use case with them, I discovered that much of the tooling used for dependency management was Gantt chart based, which can identify when to start/stop projects, their dependencies, and also their critical path. However, when looking across an enterprise, nothing gave them a ‘galaxy view’ or could identify the real impact if a piece of work was delayed or cancelled.
So, how did i2 make the difference?
IBM i2 Analyst’s Notebook was able to quickly represent the data in a network, allowing the Transformation Strategy & Planning team to quickly gain a ‘galaxy view’ of all their programs, projects, dependencies, and delivery teams.
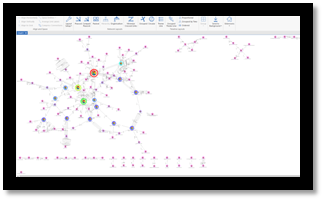
Using the analytical capabilities in i2 Analyst’s Notebook we could easily discover:
Strongly interlinked projects and dependencies
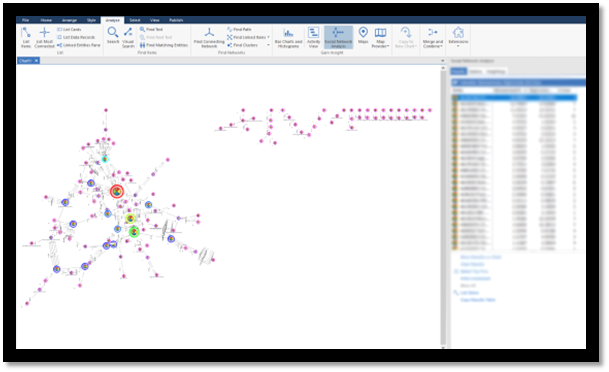
Through the use of Social Network Analysis centrality and clustering algorithms, the user was able to ascertain the projects and dependencies the data was pointing at. This was an interesting lens to put over the data as in some cases this did not point to those projects and dependencies that had the strongest or greatest focus within the business and therefore their importance could be easily overlooked.
The most critical dependency and teams across multiple projects using 'find connecting entities'
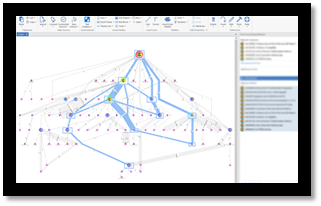
Multiple projects were selected and the shortest path that connects them all was quickly identified. The intermediate entities reflected the most critical dependencies or teams within the business.
Critical path and overlaps of all the dependencies
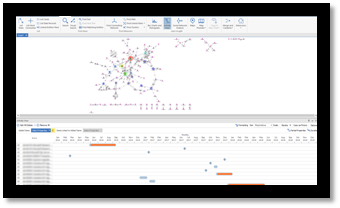
As all the deliverables had a start and end date, Activity View was used to identify all critical co-dependencies as overlaps. Enabling the business to ensure that all required resource was diverted to those projects, so they did not overrun. Using the same functionality, a critical path could be clearly identified and validated.
Most at risk days for projects based on the delivery of the project
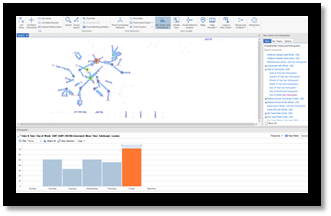
Bar charts and histograms identified a worrying trend that almost all dependencies were delivered to awaiting project teams; these were nearly all on a Friday. In some instances, the same Friday was when the project as a whole was to be completed, thereby allowing no time for testing or time for any alterations if issues were found.
Time sensitive work
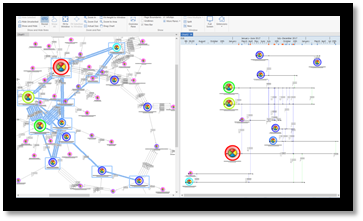
Rather than just assessing dependencies and projects in a network chart, the Copy to Timeline feature allowed key sequence of event information to be visualized. This enabled the team to see how projects would be affected if they were delayed or started earlier or later than planned. This uncovered where flexibility could be achieved if required.
This proves that if you can model the problem as entities and links, i2 can make a real difference in any situation!
The next step is to look at i2Connect to connect the underlying project data to the i2 chart rather than having to run exports.
#i2