By Holly Wright and Thomas Obremski.
For those who haven’t yet tried out the new IBM Security QRadar Network Visibility Pulse dashboards available on the IBM X-Force App Exchange, here are some of the highlights.
Overview Dashboard
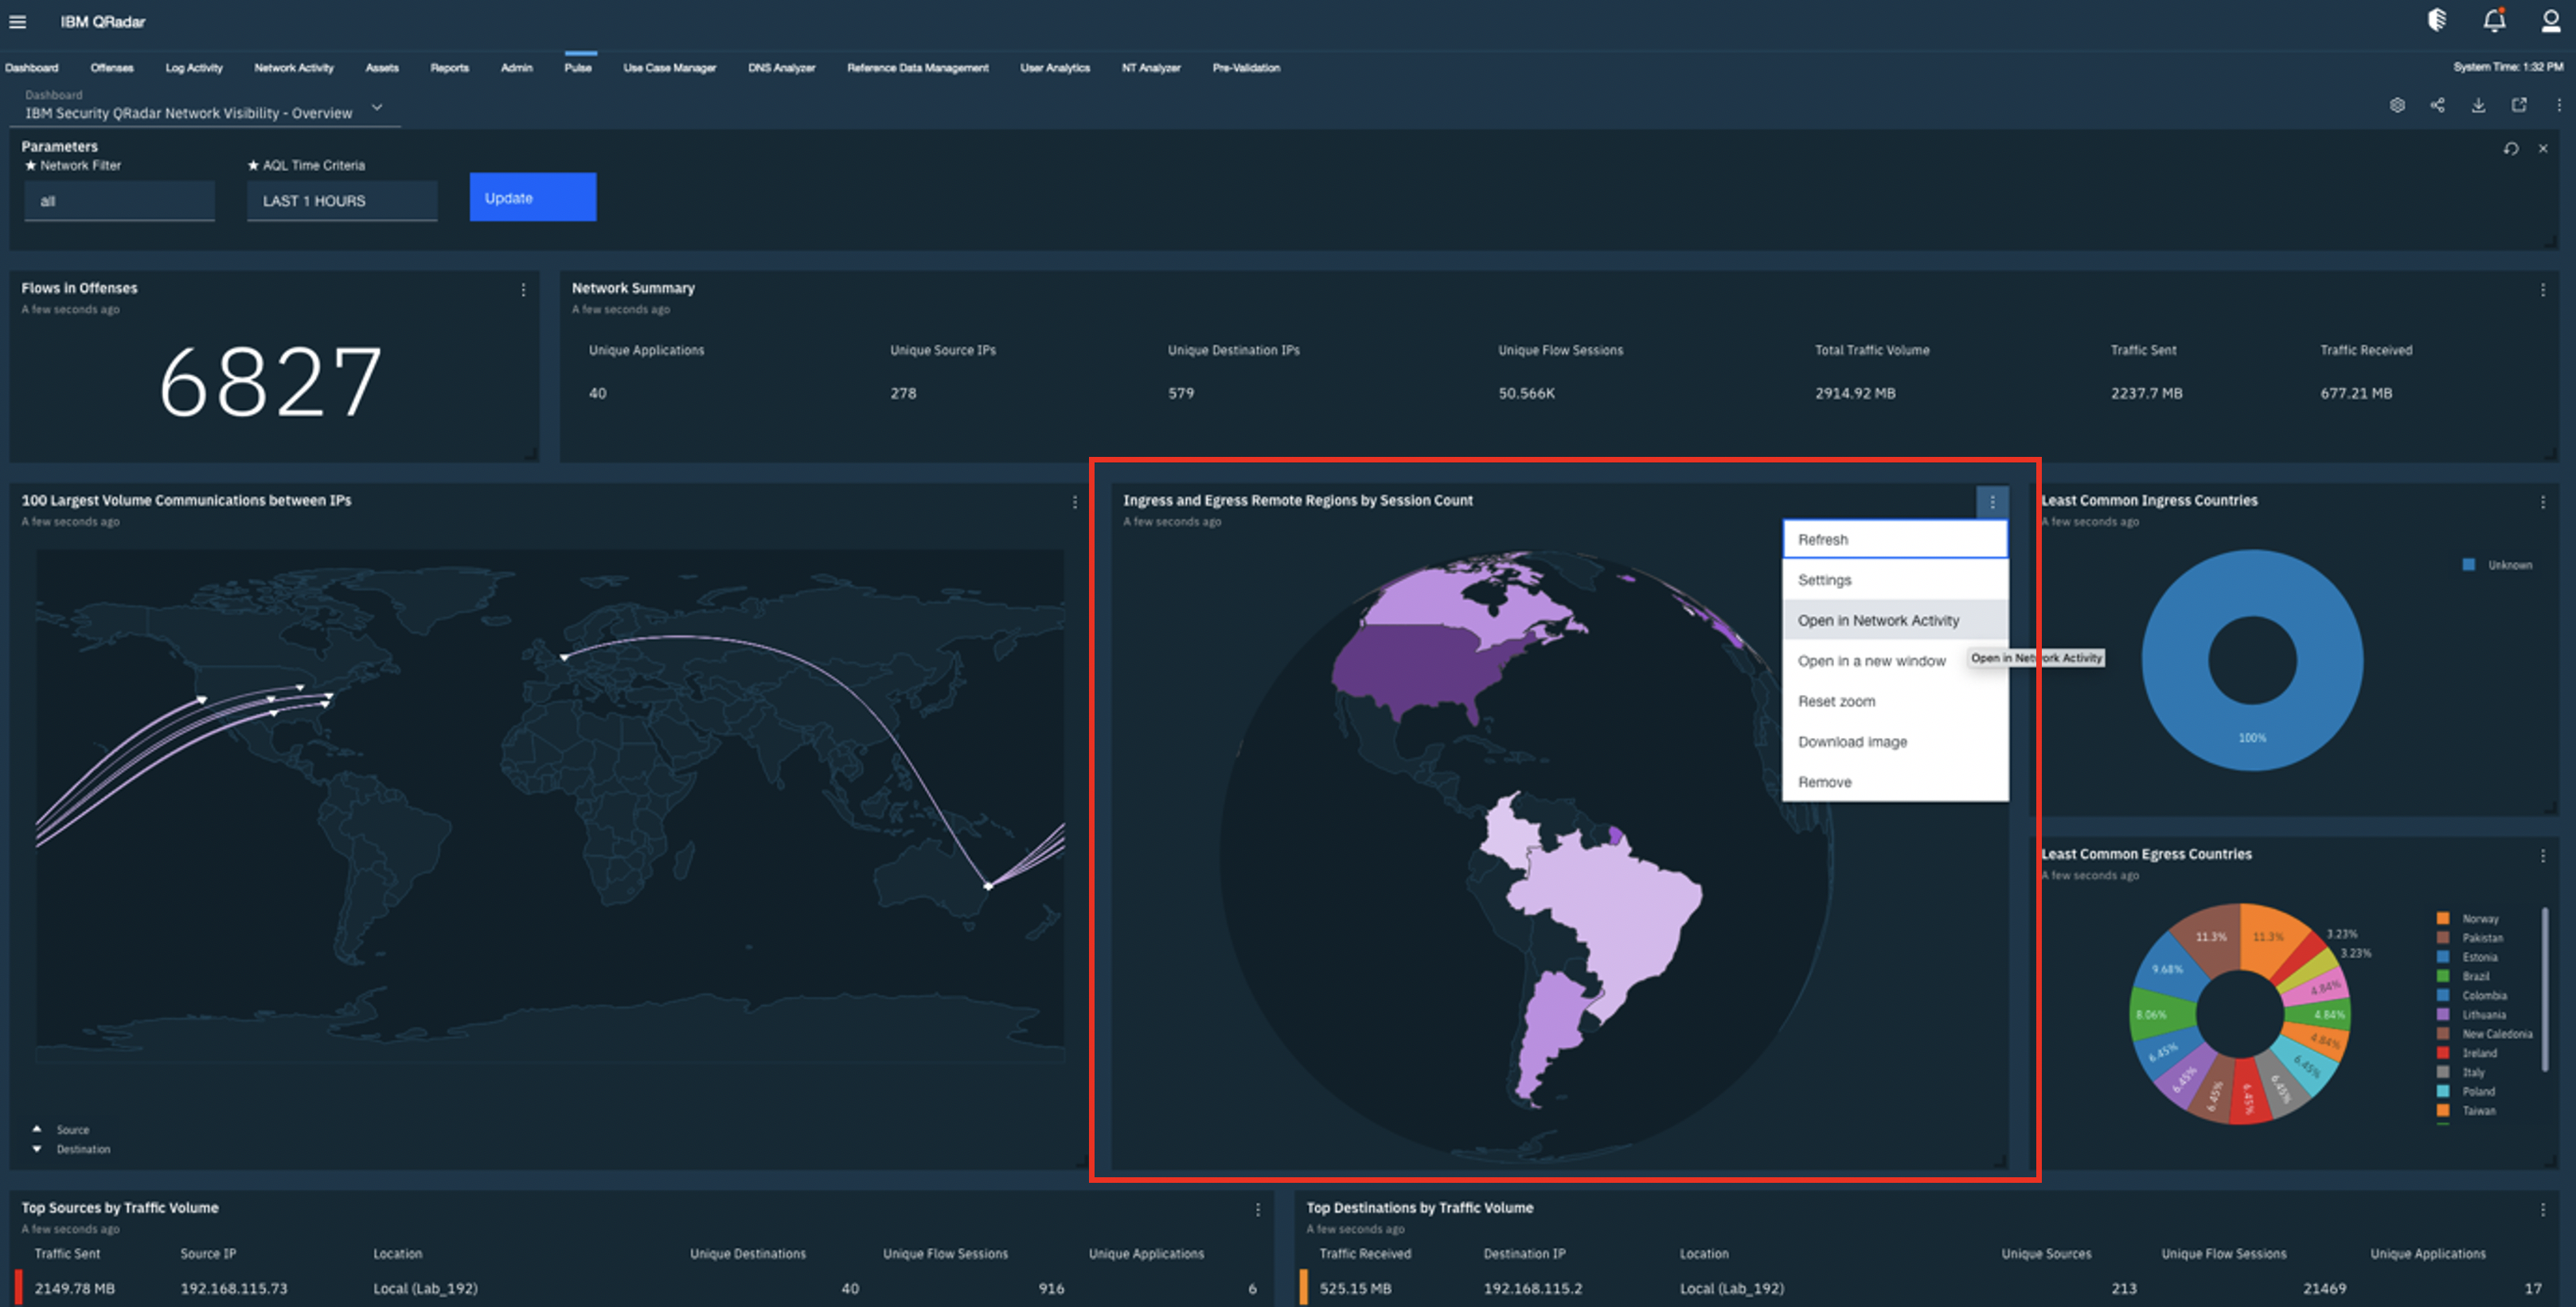
The overview dashboard provides an at-a-glance view of what is happening across your network. Not only can you see geographical representations showing communication patterns across your organization, you can also see the frequency of communication to detect low level communications patterns buried within normal business activity. There are breakouts by application, protocol, network segment and direction (ingress vs egress). This makes it easy to spot communications patterns that don’t belong for your organization.
In the following example we look at the number of ingress and egress sessions from various geographies and spot those that are unusual for our organization.
To investigate further, you can right click and pivot into the details for these communications.
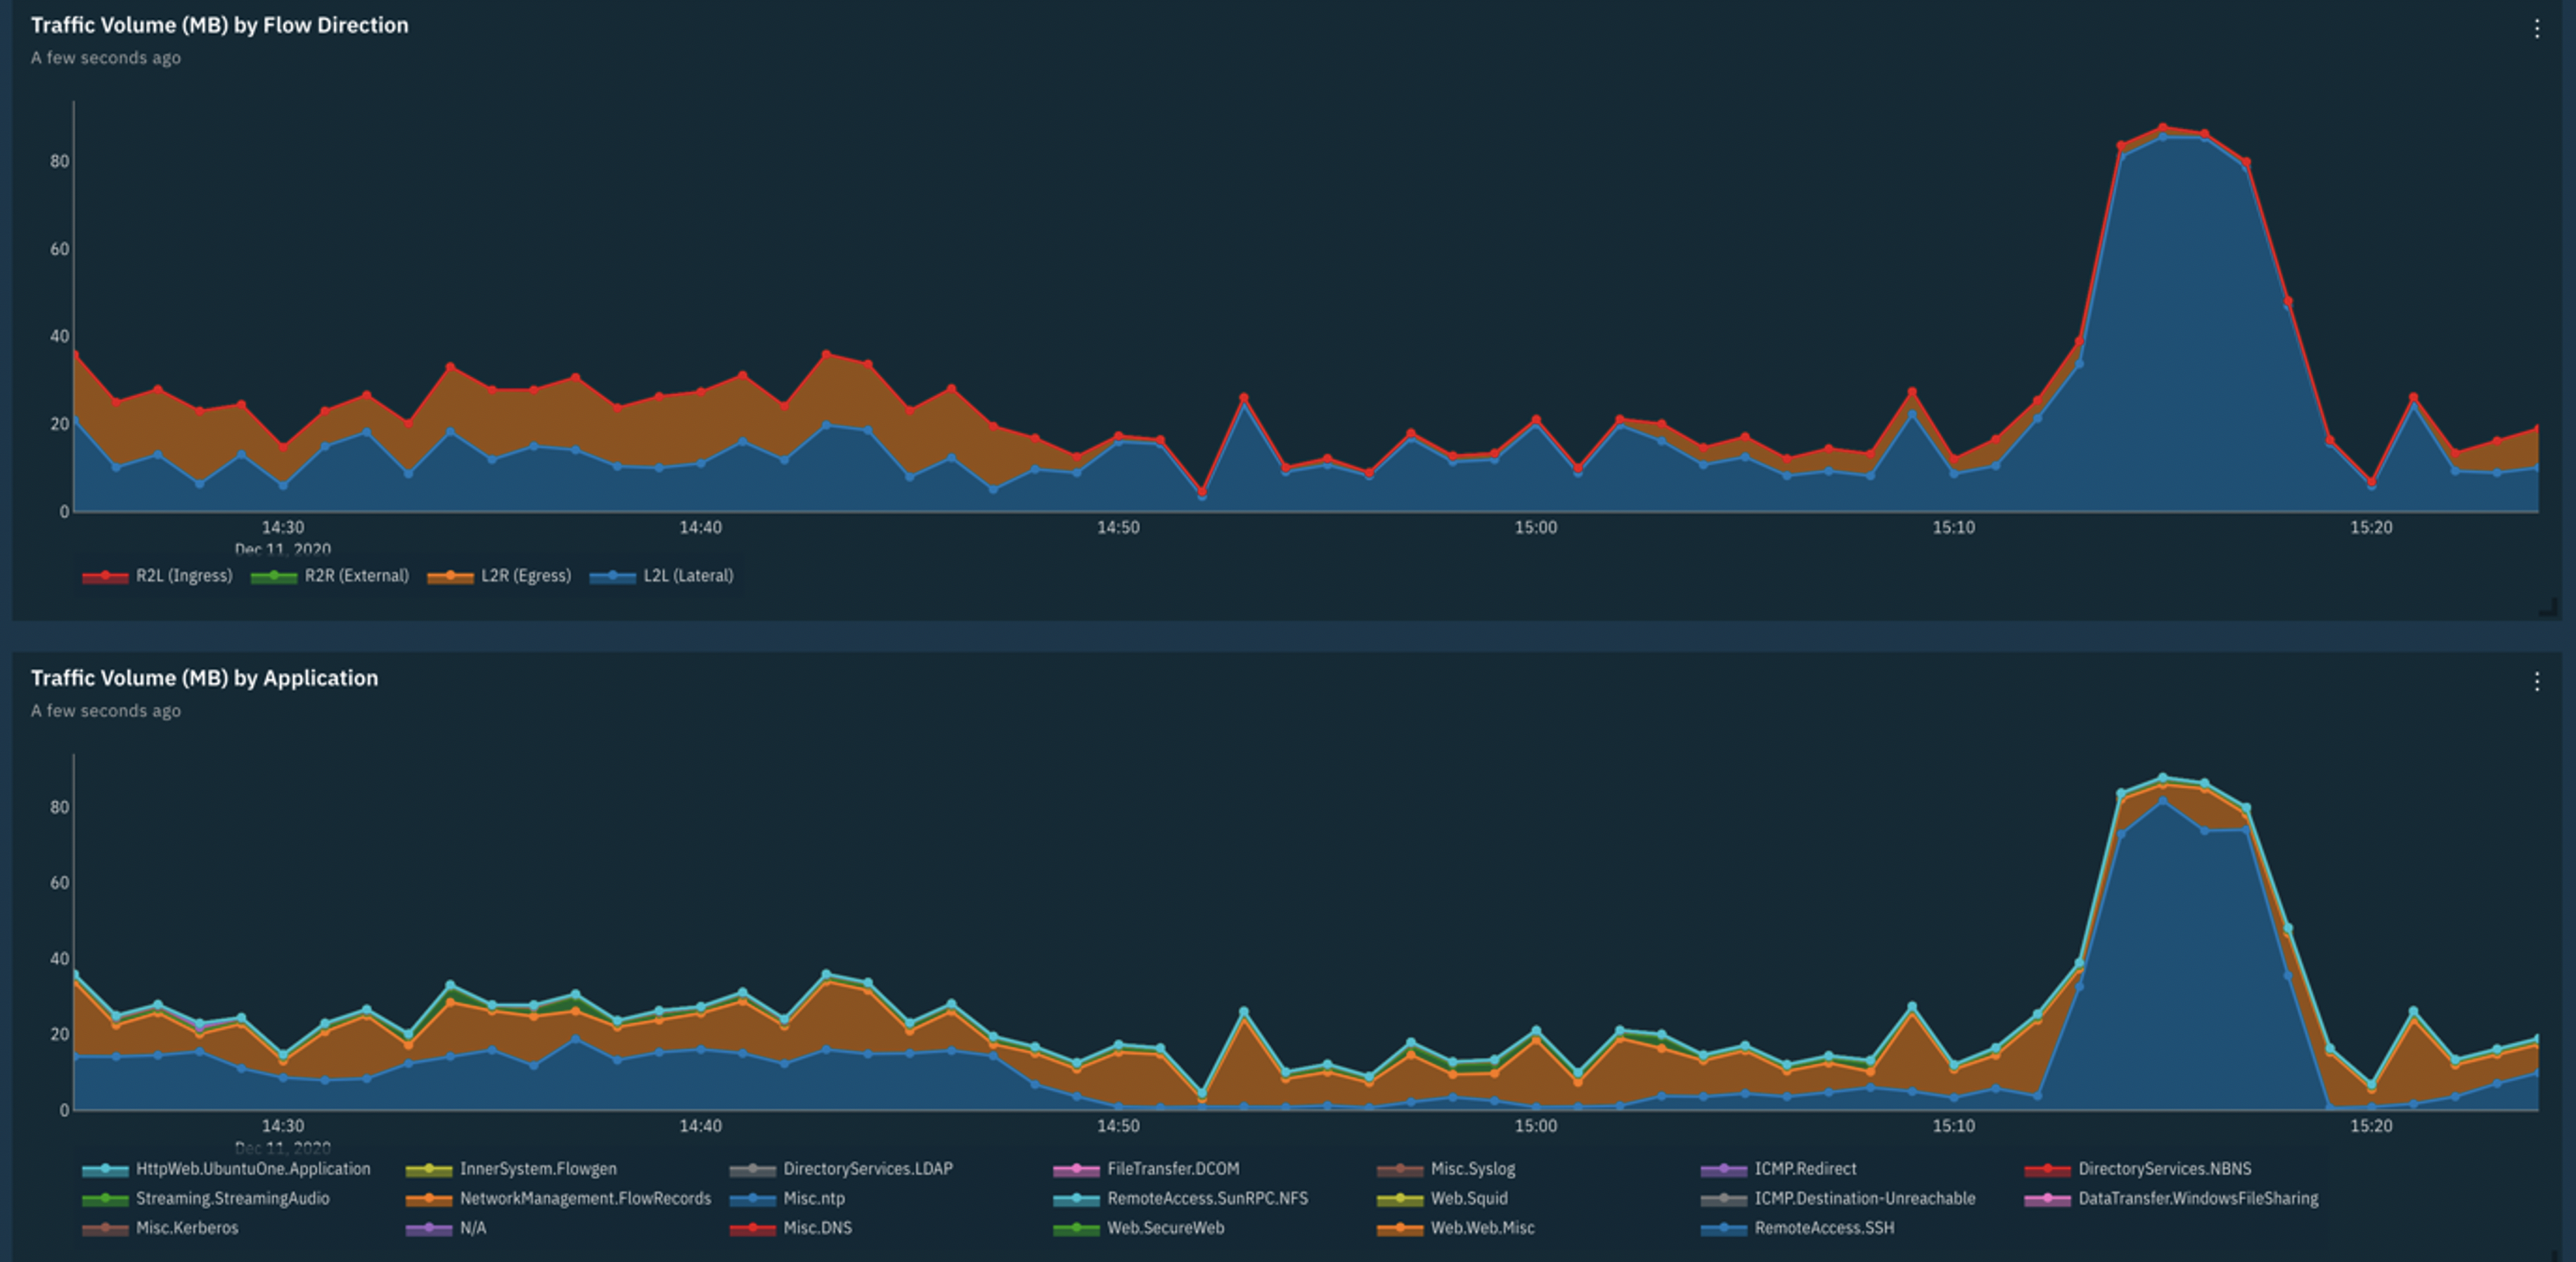
We can correlate spikes and dips in traffic volume, and get quick insights into the direction, application and networks associated with these patterns.

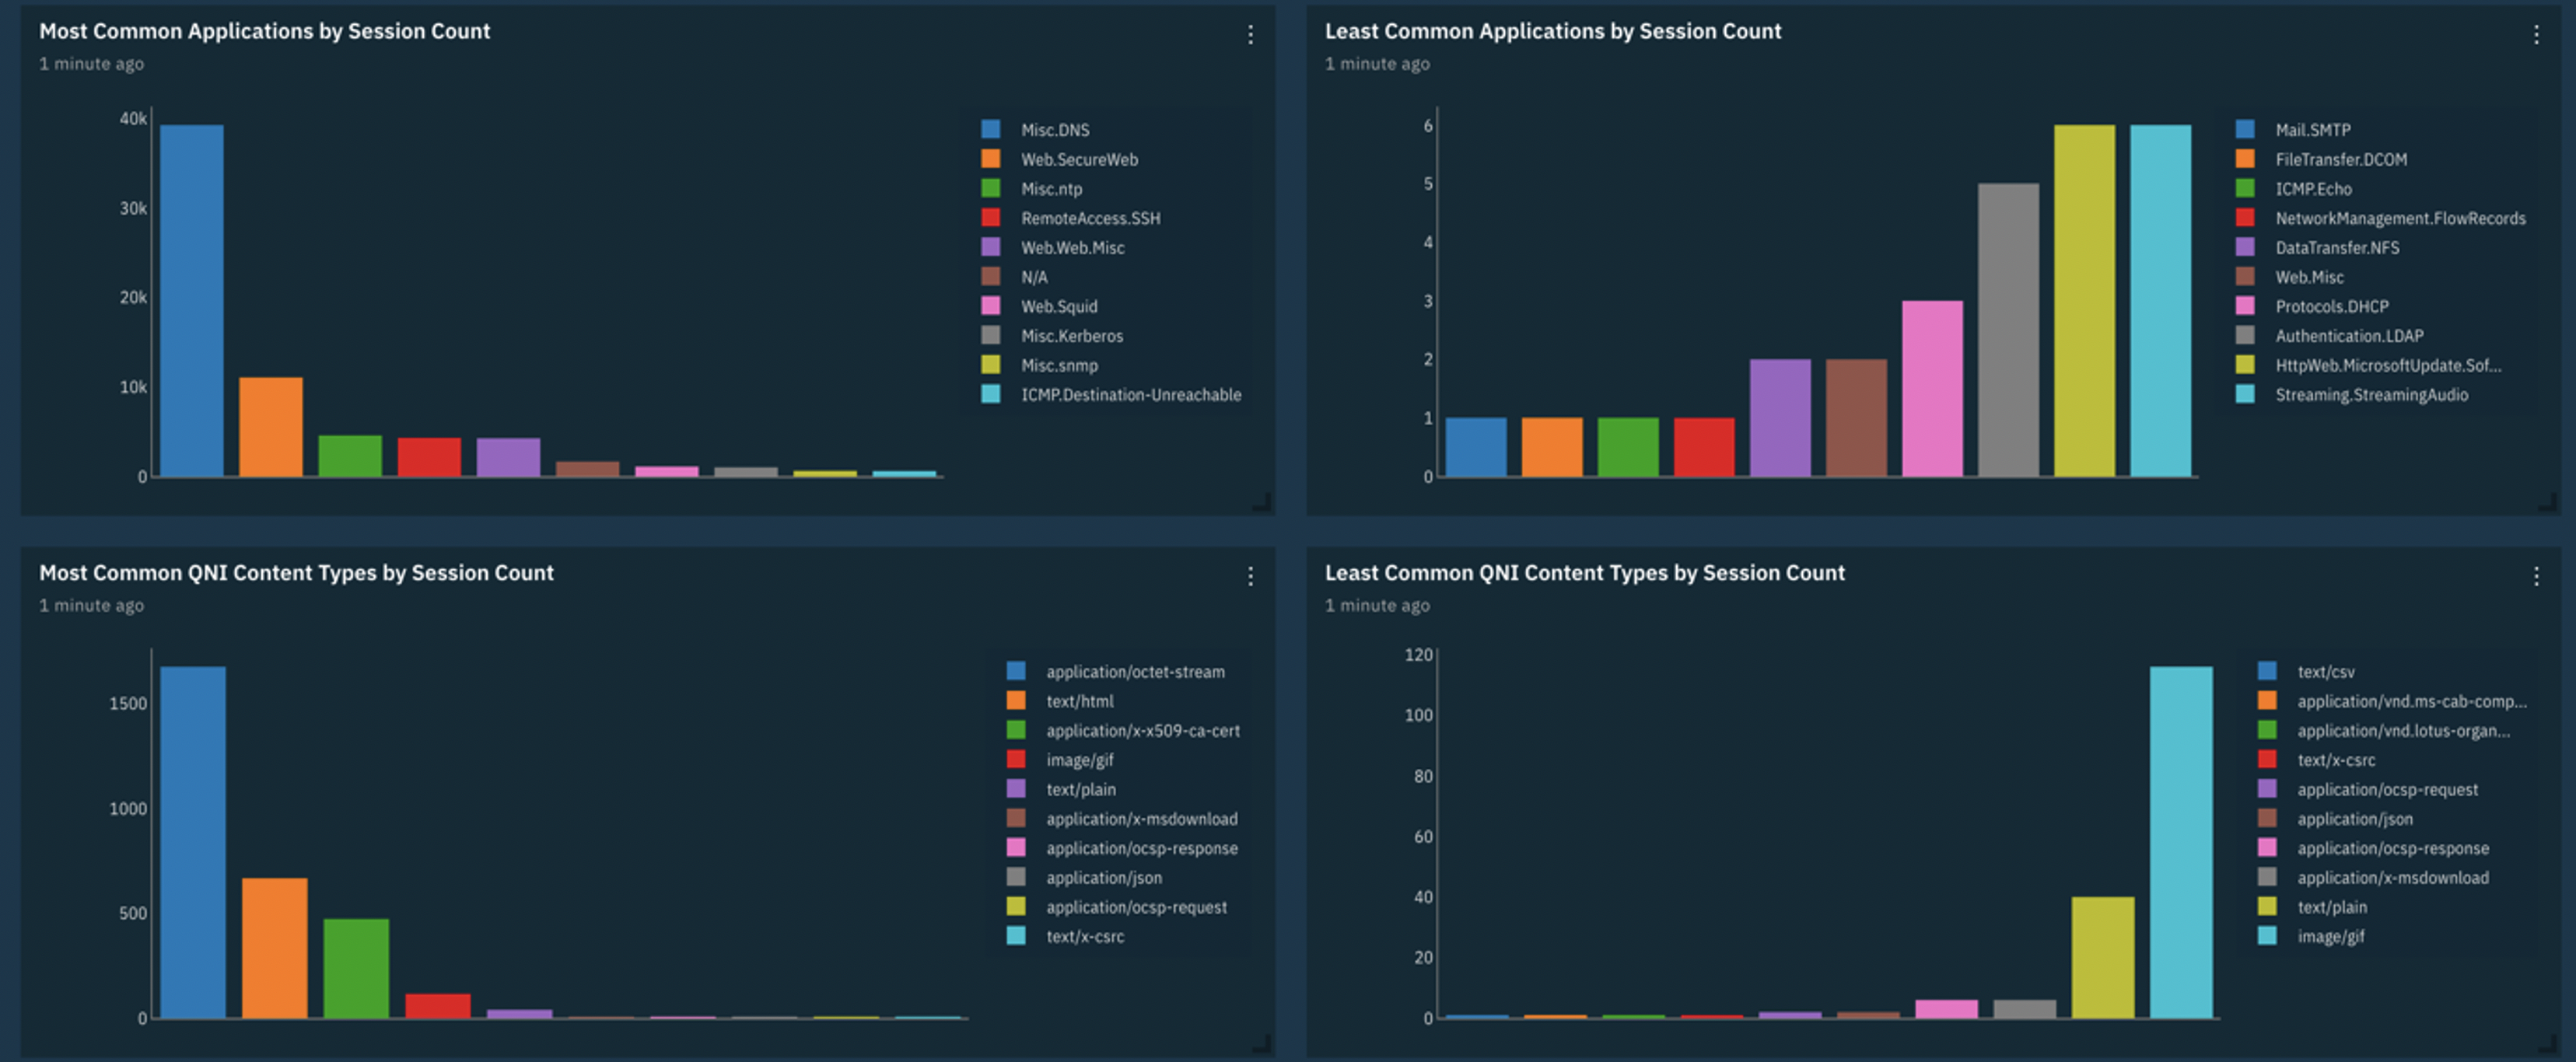
We can also utilise side by side comparisons to compare the least and most common applications to quickly assess the applications in use across our networks and those that may be unexpected. We can also do similar comparisons with Content Type to ensure that the content traversing our networks is what we would expect.
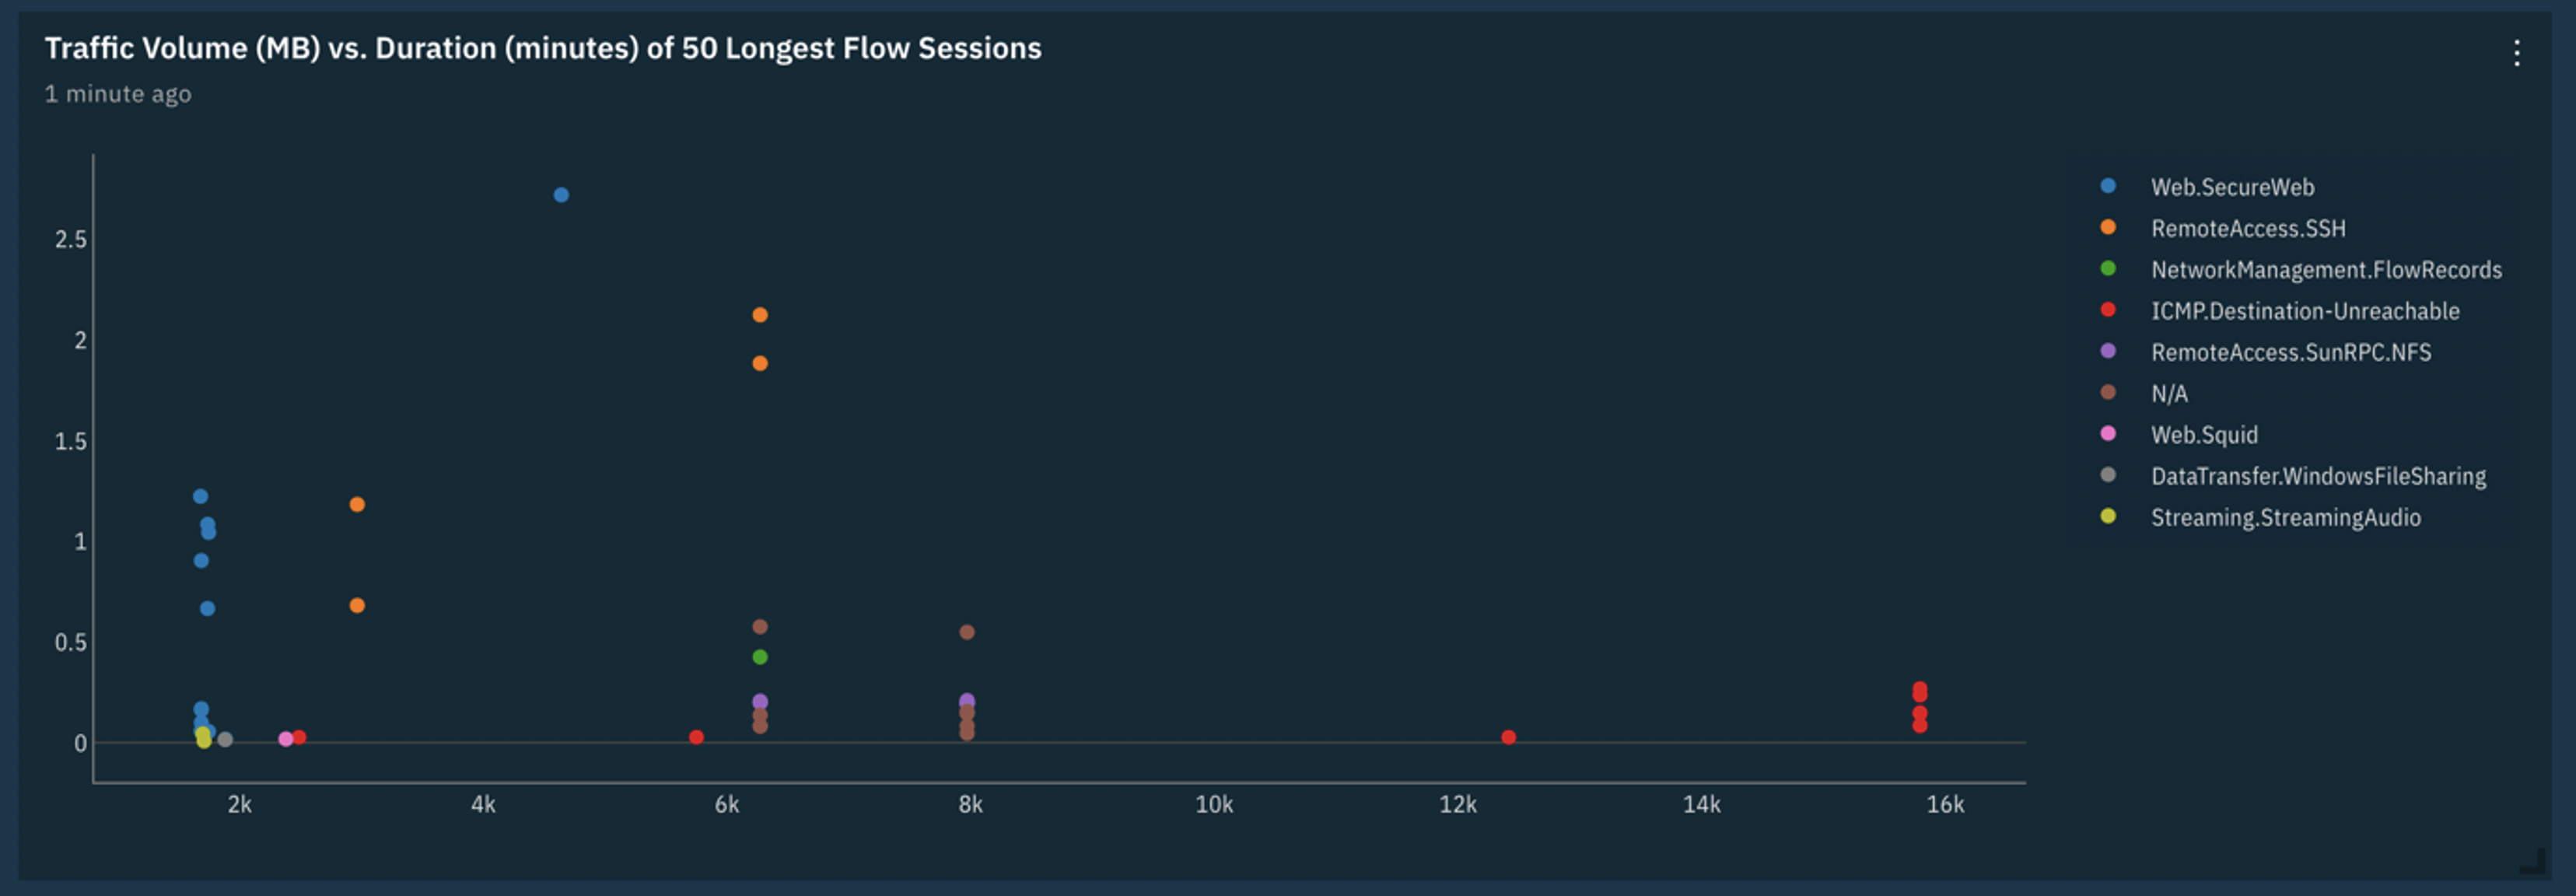
The dashboards allow us to easily identify long running network sessions and through correlation with traffic volume we can detect long and slow communication patterns that could be indicative of data exfiltration.
IP Details Dashboard
Should your investigation lead you to specific IP Addresses of interest, there is an IP Details dashboard that provides visualizations that allow you to see everything that is happening on the network with that IP Address.
Simply select the IP Details dashboard.
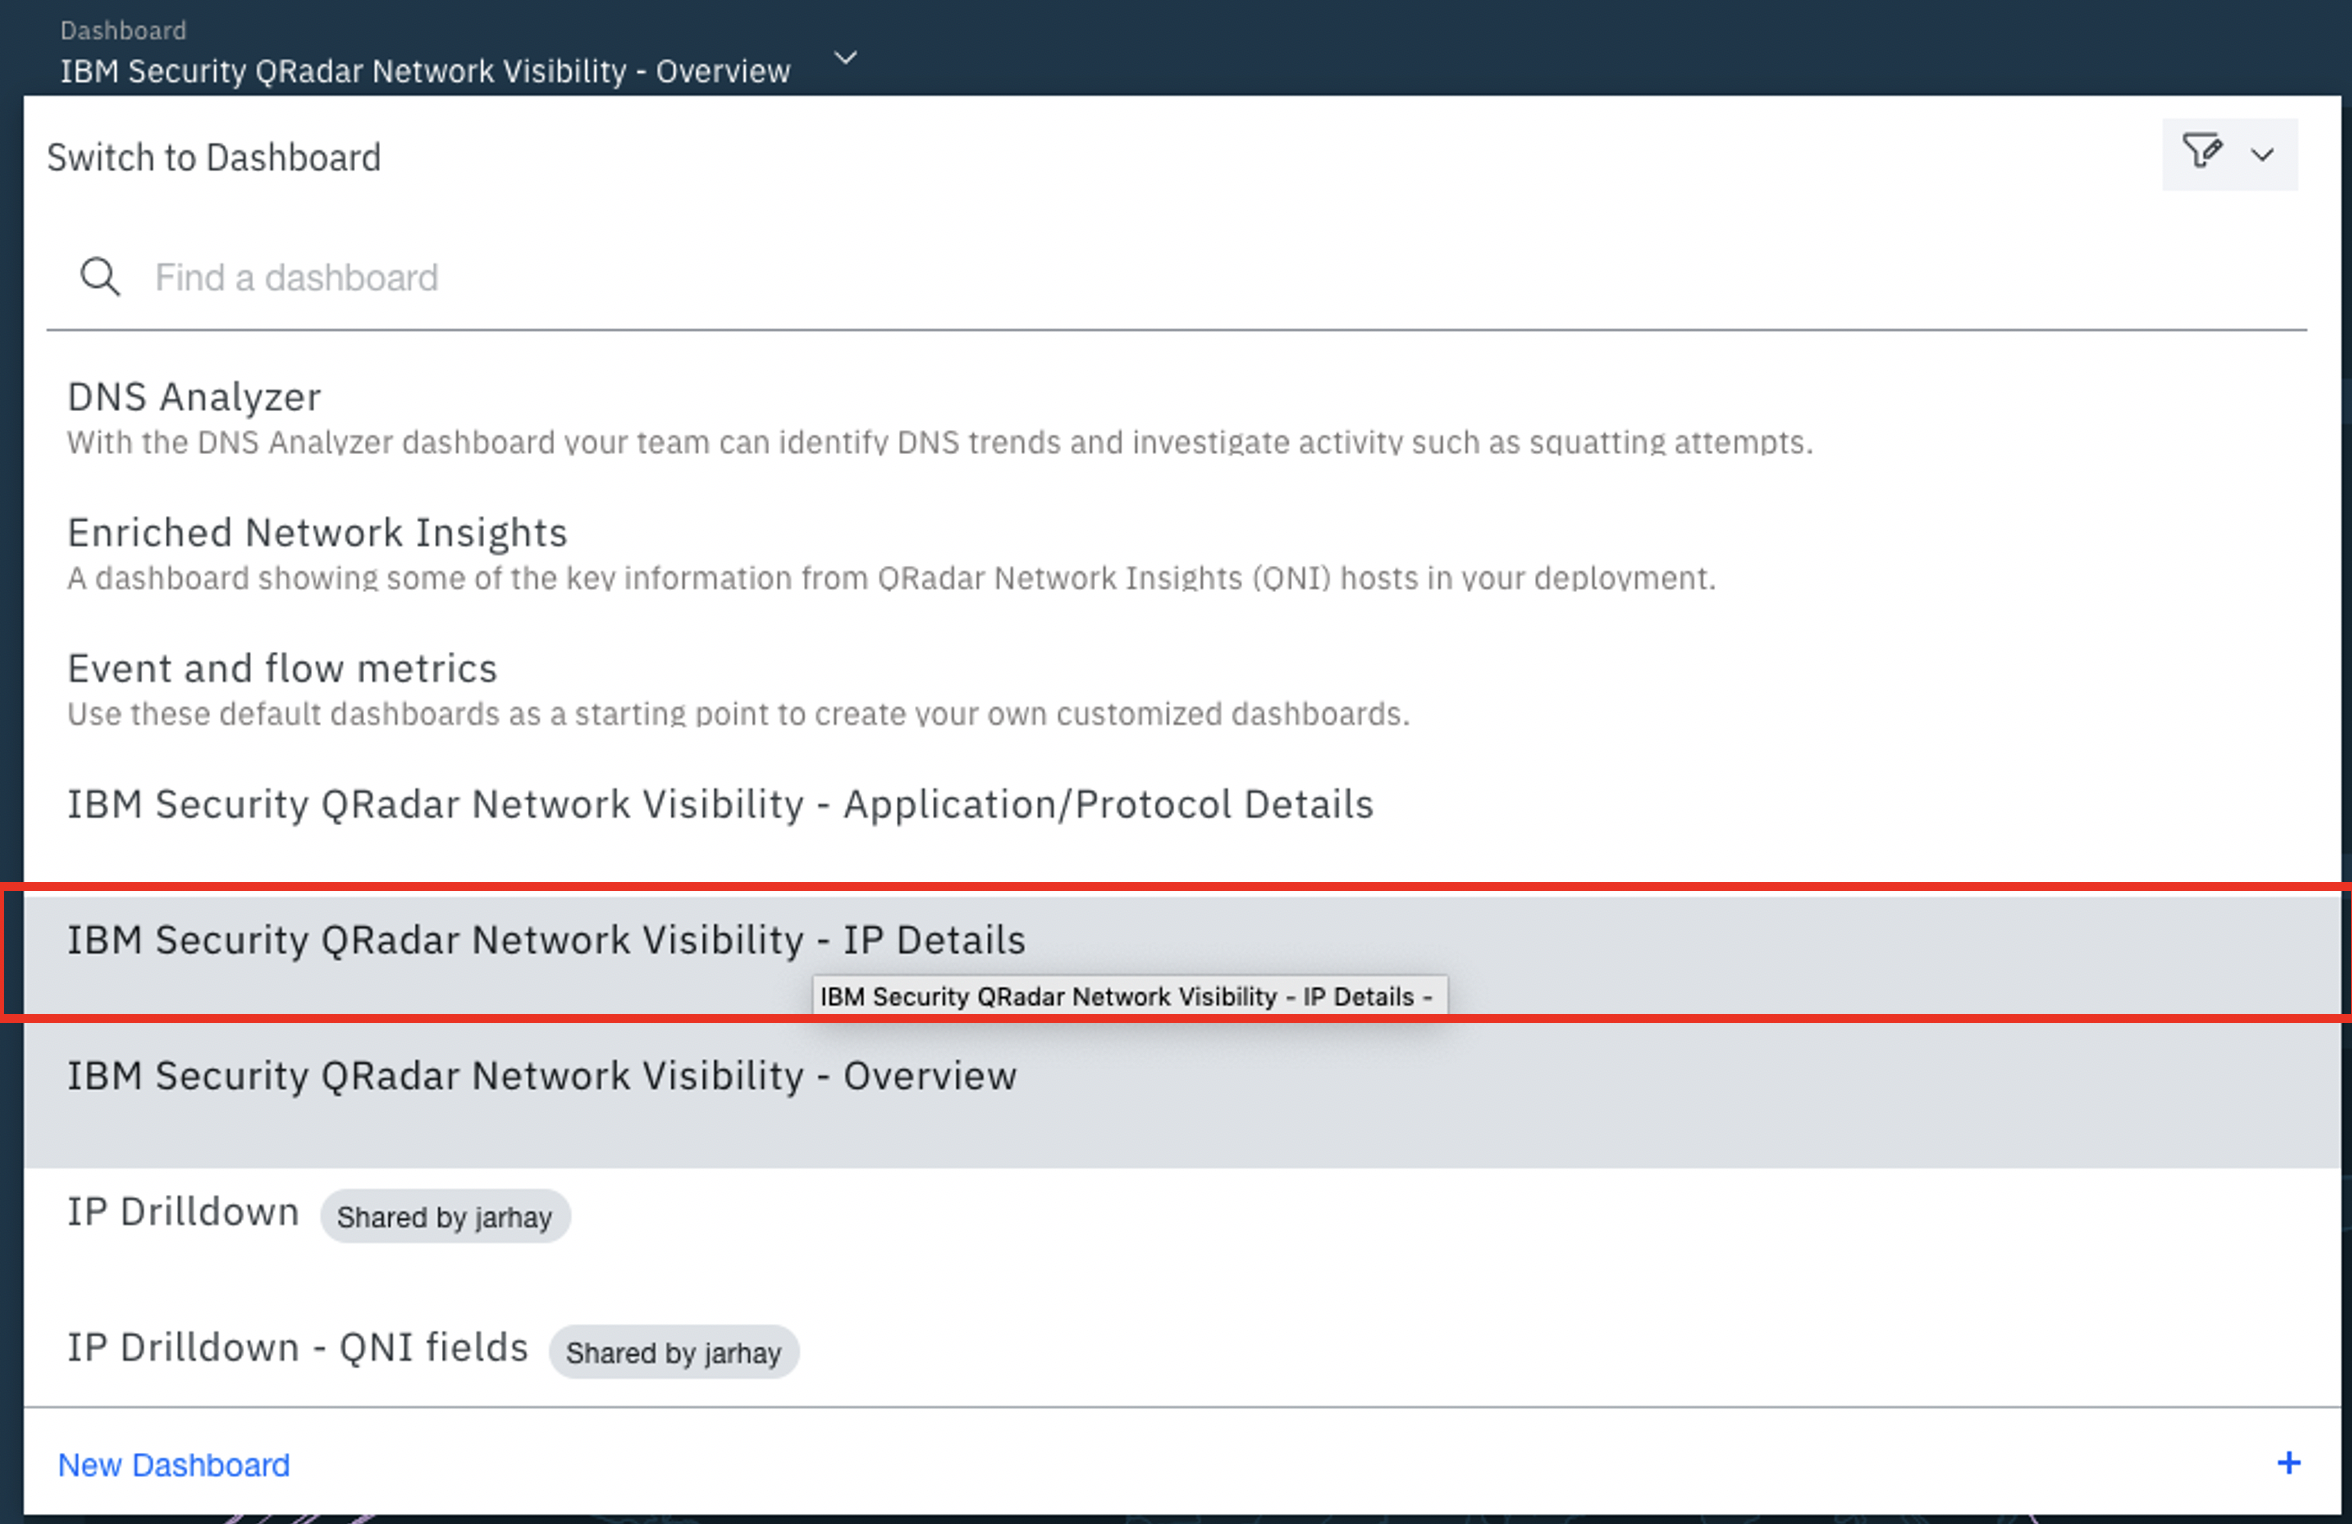
The IP Details dashboard allows you to enter an address of interest and gain insights into the communications with that IP.
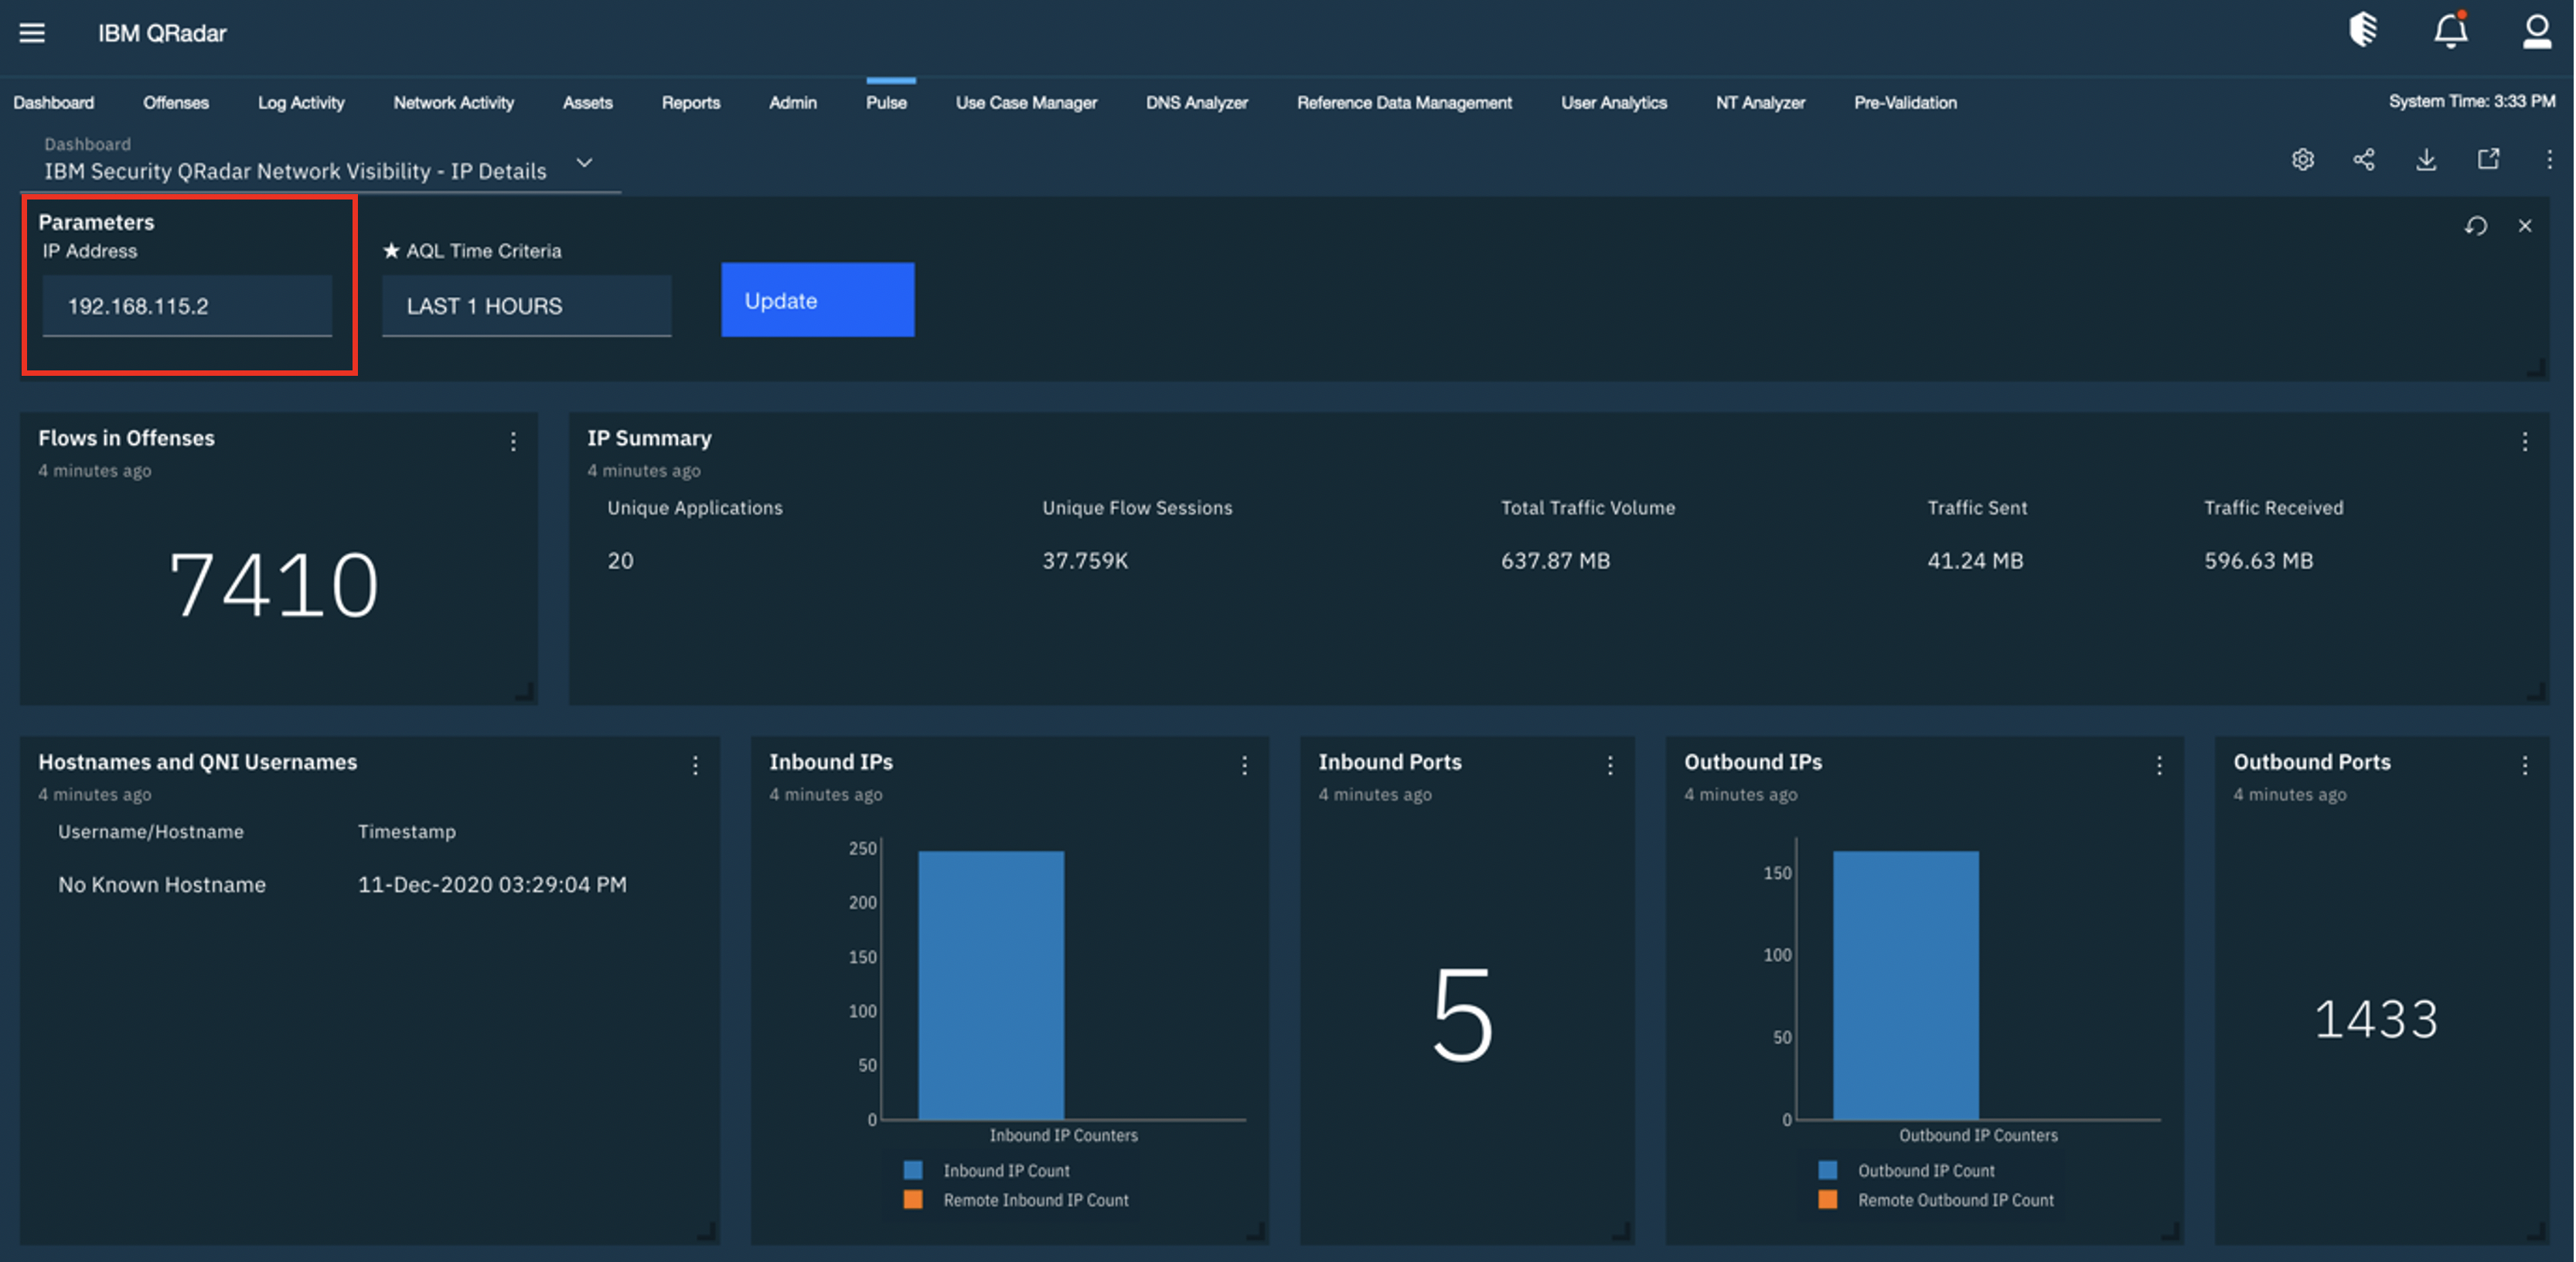
The IP details page has a number of visualisations that can help detect anomalies associated with the selected IP address. The below visualisation can be used to gain an intuitive understanding of the typical volume and type of traffic that you would see from this device. You can use this chart to spot discrepancies in usual behaviour, whether it is unexpected application usage or unusual data volumes at points in time.

Here we can see a breakdown showing the duration of communications with this IP. We can see that sessions typically will only last for a few minutes, so the long-lived sessions may warrant further investigation.

We can utilise QRadar Network Insights to help detect potentially malicious files based on their content. Here we see file entropy (the degree of randomness within the content) to look for outliers based on the type of file.

Delving further using this dashboard we can get an at-a-glance understanding of the types of communication that this IP engages in, both in terms of inbound and outbound traffic.

Application/Protocol Details Dashboard
Similarly, we can visualize and investigate the activity on the network pertaining to a particular application or protocol with the Application/Protocol Details dashboard.
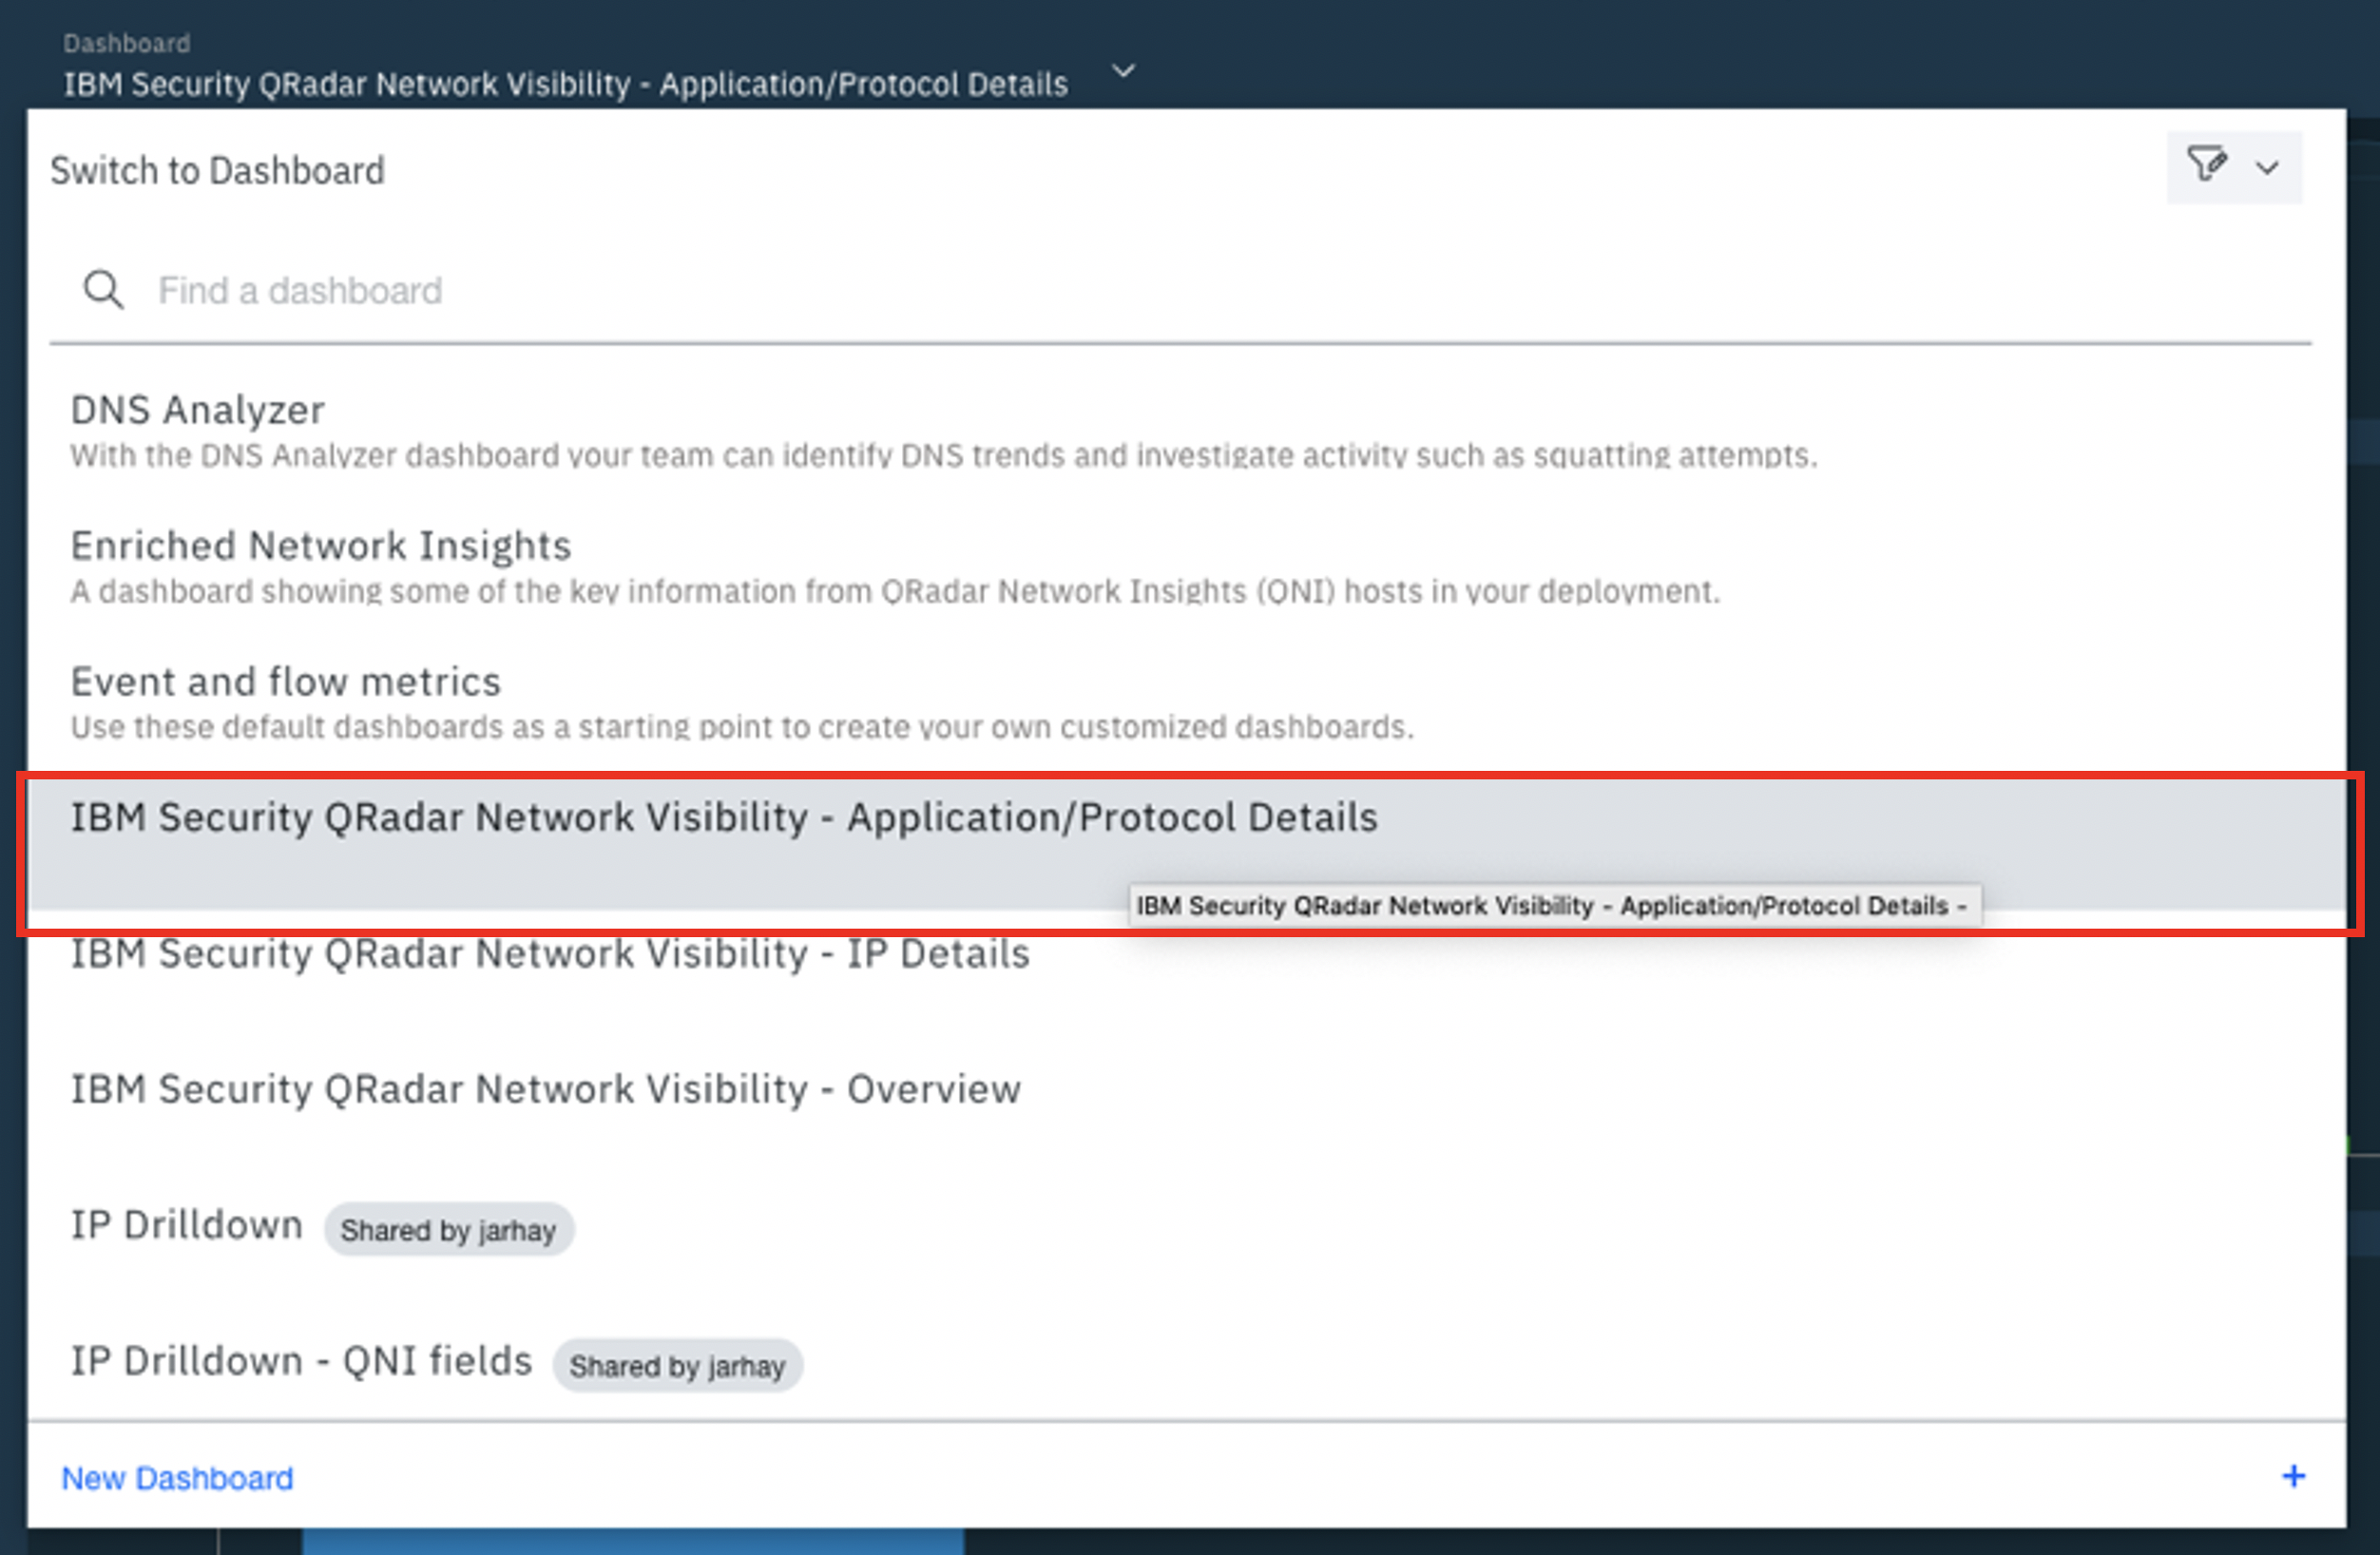
In this example we look for patterns within web traffic.
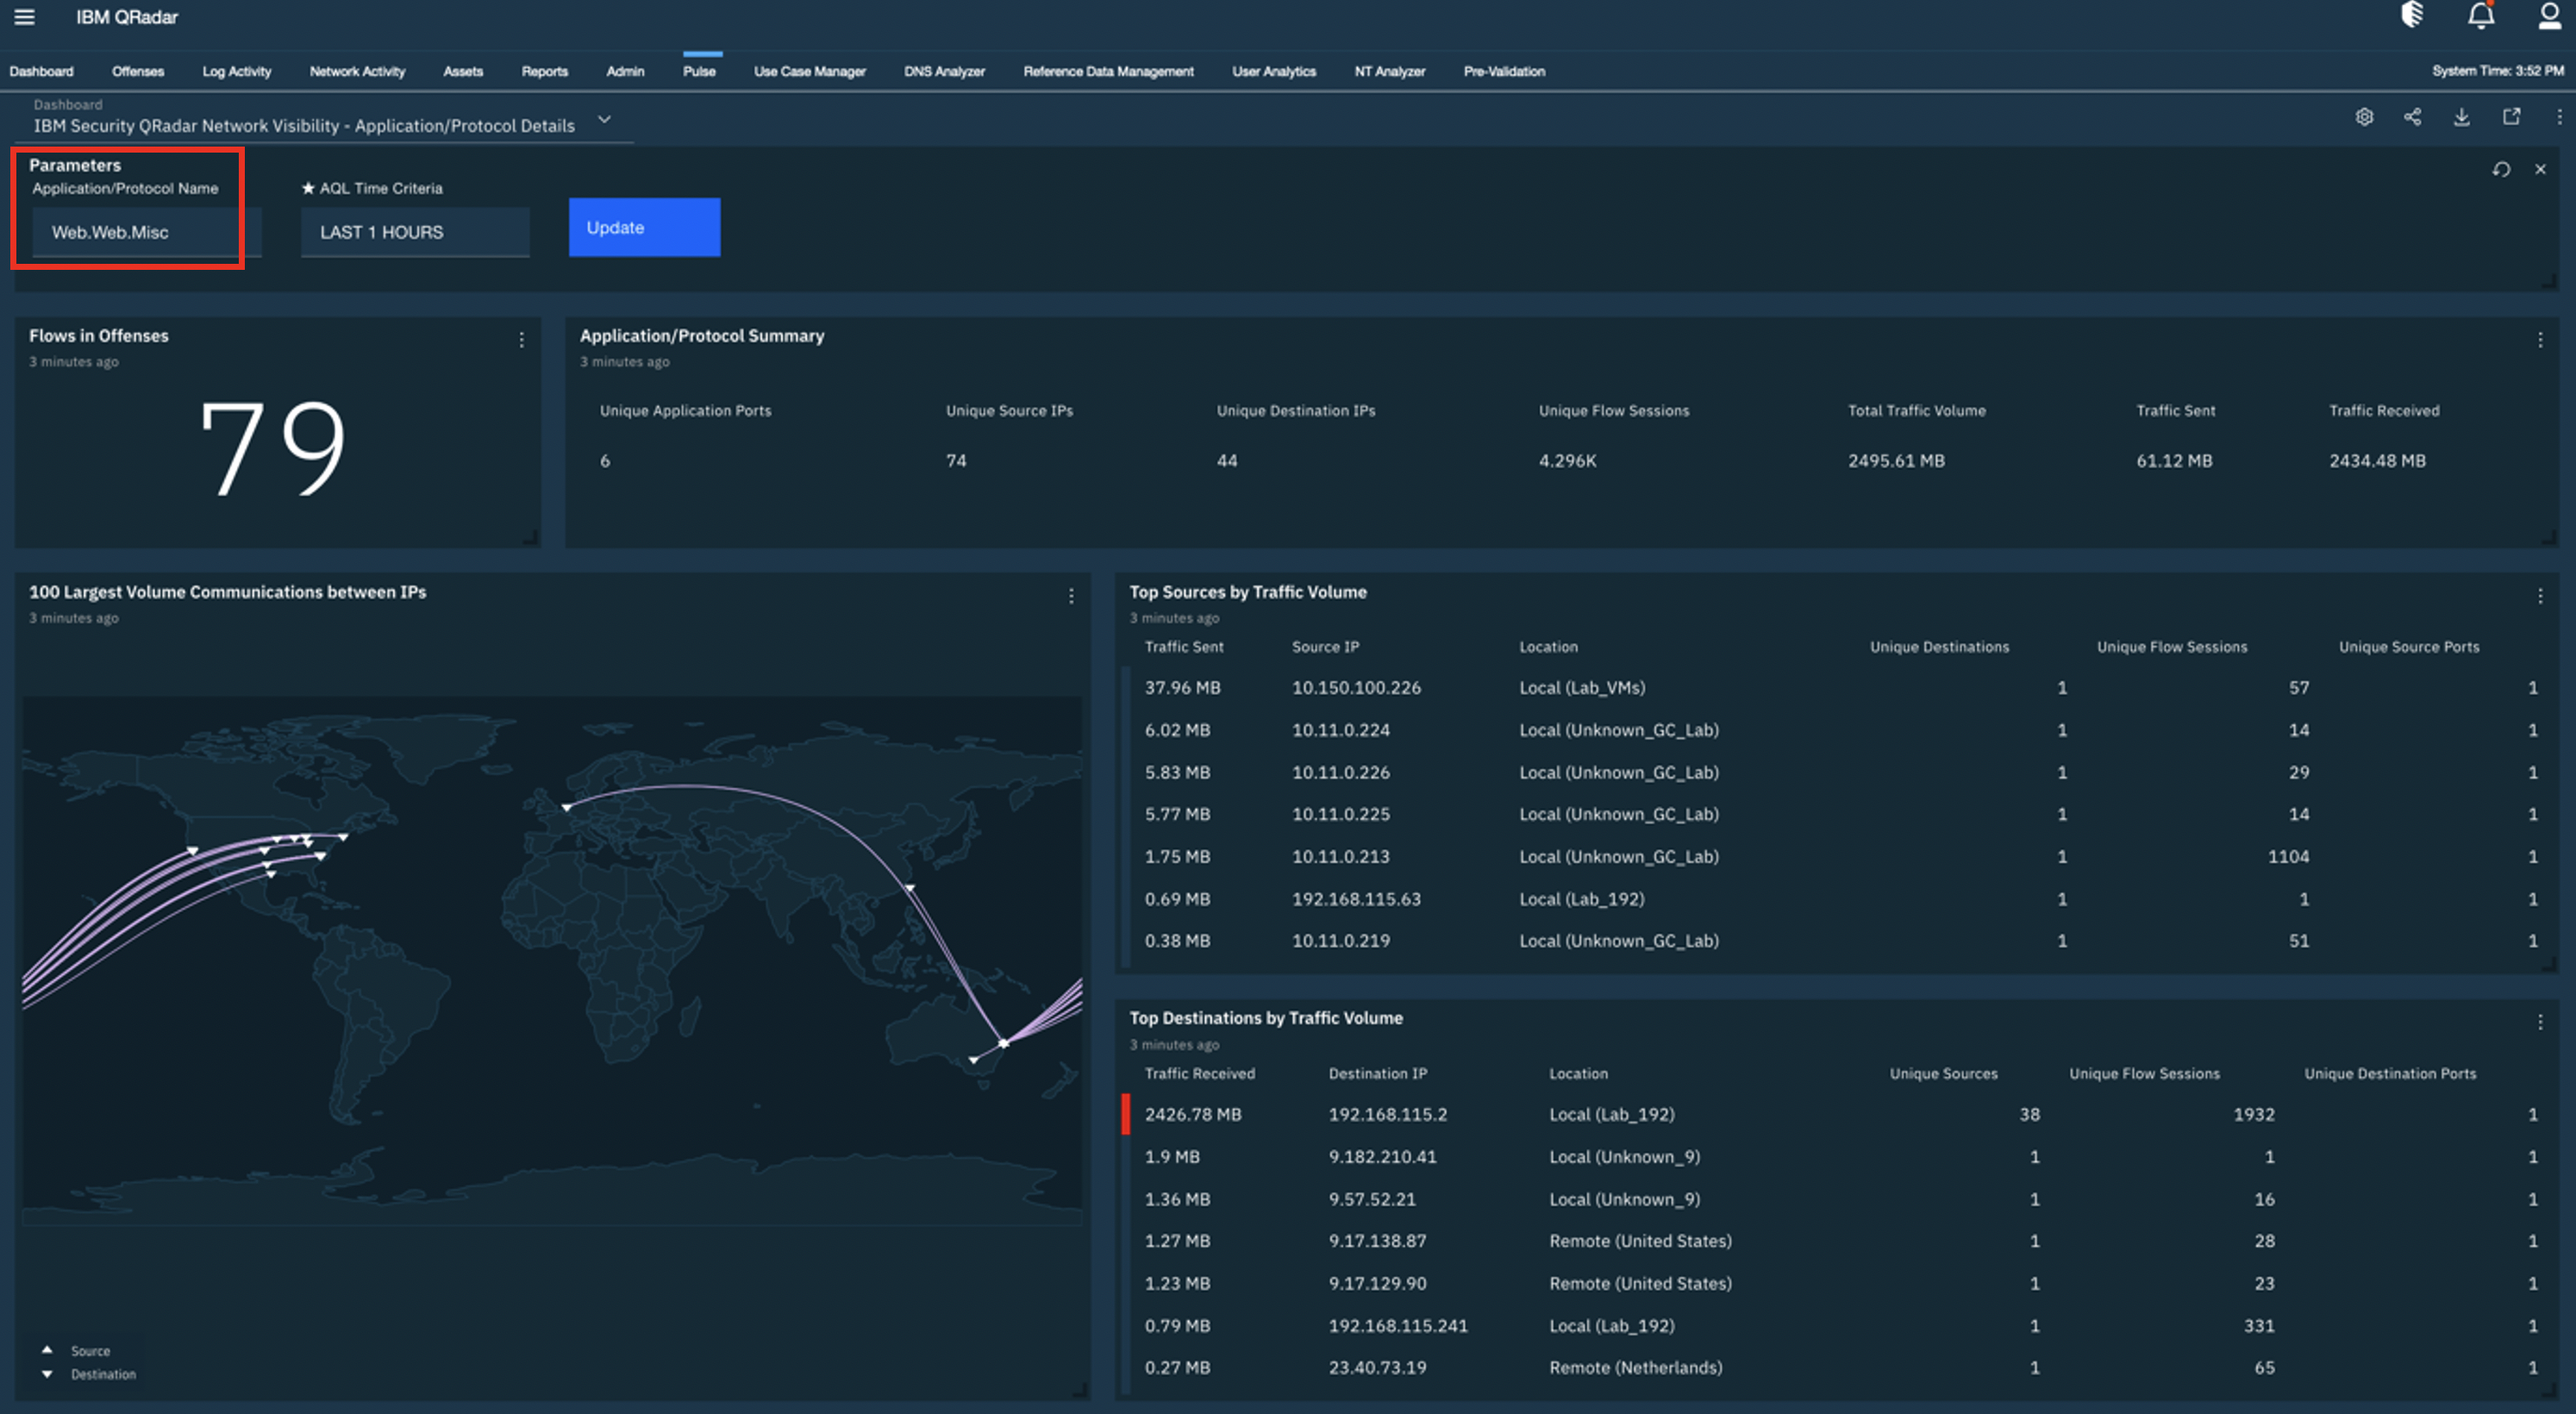
The dashboard shows us a range of statistics about the application or protocol of interest. We can see how many of these flows are associated with offenses, how common this application/protocol is and what the bias (ingress vs egress) of communication volume is for this application/protocol.

We would typically expect web traffic on port 80 (or 443), but below we can easily see other ports are being used on an infrequent basis. For those with QRadar Network Insights these sessions will be automatically identified as nonstandard port usage through the Suspect Content Description fields.

There are many additional visualizations to help you attain the deepest insights into what is happening on your network. More information including a video tutorial on the IBM Security QRadar Network Visibility dashboards can be found on the X-Force App Exchange.
#Featured-area-2#Highlights#Highlights-home#QRadar