I'd like to create a time trend report that shows years in the columns and months in the rows. Additionally, I'd like to show the months under Account Group column. I'm wondering if there is a work-around to achieve the below format?
Account Group FY2023 FY2024
[-] Salary & Wages 50,000 52,000
Jan 25,000 26,000
Feb 25,000 26,000
~Prem
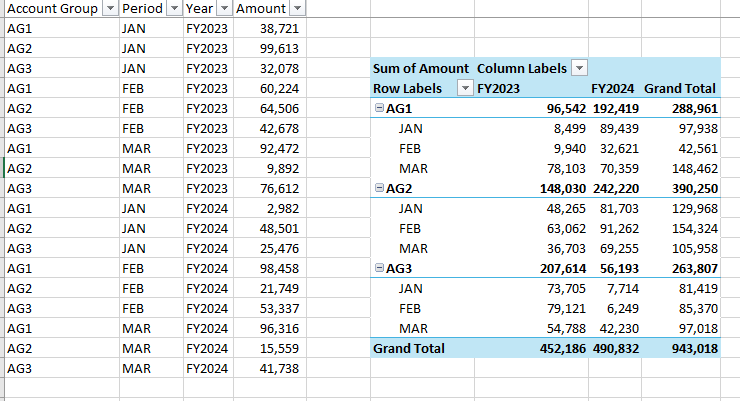
To understand a possible data structure, I created the following in Excel:
I'm thinking how to get Apptio to populate the table on the left, so that it can create the one on the right. More to follow... @Prem Kilaru