Introduction
PowerVC 1.4.2 and earlier versions have the capability to store CPU and memory utilisation of Compute hosts and virtual machines (referred as VMs/LPARs from here on). PowerVC 1.4.3 adds support for collection and storage of virtual machine’s storage and network I/O metrics. These metrics are gathered using HMC’s PCM (Performance and Capacity Monitoring) and queried from HMC using its K2 APIs. This applies to NovaLink host as well. These metrics can be obtained using OpenStack Gnocchi REST APIs in PowerVC.
Metric collection configuration
The first thing to note is that these new VM I/O metrics are not enabled and stored on PowerVC by default. User will need to configure PowerVC to enable collection and storage of new metrics by using the
powervc-config command. Below is an example where the network and storage I/O metrics are enabled on PowerVC. The last parameter
--restart restarts the ceilometer services for the configuration to take effect.
powervc-config metering enable-meters --meters network.incoming.bytes,network.outgoing.bytes,disk.device.read.bytes,disk.device.write.bytes --restart
Viewing Metrics
Once the metrics collection is enabled, user can view the metrics using the Openstack Gnocchi APIs. To obtain the CPU utilisation metrics for a VM, the following would be one of the approaches:
- Identify the Gnocchi ID of the VM from the list of all VMs.
GET powervc/openstack/metric/v1/resource/instance
- Get on the CPU utilisation metric for the VM.
GET powervc/openstack/metric/v1/resource/instance/gnocchi_id_of VM/metric/cpu_util/measures
For the new VM I/O metrics, the approach is a little different. The CPU utilisation and memory utilisation metrics are associated with the virtual machine, so one would query the Gnocchi resource ID of the VM and then query its CPU/memory utilisation metrics. In Gnocchi data model, storage and network interface are defined as standalone resource type. It is not a hierarchical structure from VM -> disk/network interface -> metrics. The top level resource type is disk/network interface and sits in parallel to “instance”(VM) resource type. So user needs to get the ID of network/storage interface and then query its associated storage/network metrics.
There might be a question about the association of VM disk and network interface with the VM if they are stored as standalone entities. The answer is that each disk/network interface resource has a field called “instance_id”, which is the ID of the VM that the disk/network interface is associated with.
Given below is the approach to get the storage and network metrics.
- Get the Gnocchi ID for the VM.
- Identify the network interface/disk. For network interface, identify its location code. For disk, identify the storage adapter’s name.
- From the list of all network interfaces/disks, identify the one which has its “instance_id” set the Gnocchi VM ID. Get the Gnocchi ID for the network interface/disk.
- Query metrics on the network interface/disk using its Gnocchi ID.
Now, let us see some examples which demonstrate the above steps.
Examples
Example 1: Get network metrics w.r.t. specific network interface.
The following example demonstrates the procedure for obtaining network I/O metrics for a VM that is deployed on NovaLink host. We make use of NovaLink command line
pvmctl to identify network interface location code.
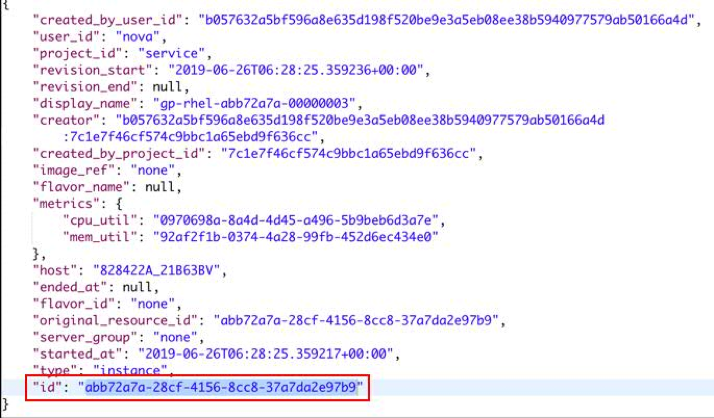
- Get the Gnocchi ID of the VM.
GET powervc/openstack/metric/v1/resource/instance
The response will contain the following details:
Gnocchi ID of VM: “id": "abb72a7a-28cf-4156-8cc8-37a7da2e97b9"
Nova ID of VM: “original_resource_id”: “abb72a7a-28cf-4156-8cc8-37a7da2e97b9”
- Identify the network interface.
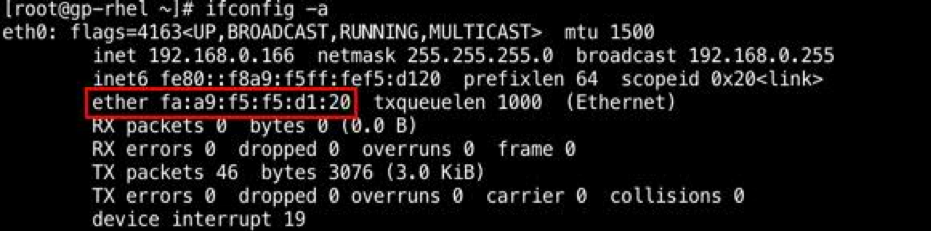
Get the location code for client network adapter (CNA) of the VM. For example, on NovaLink, you can get the location codes for CNA by using pvmctl CLI. For example, if the VM with ID 7 has eth0 interface and is configured with MAC fa:a9:f5:f5:d1:20, the ID can be retrieved in either of the following ways:
a. Get the MAC ID by running ifconfig command on the command prompt of the VM.
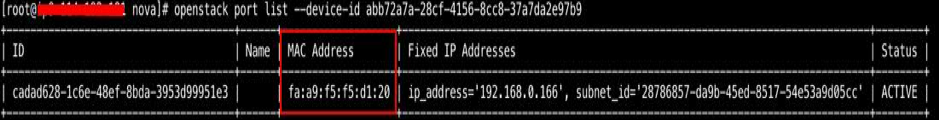
b. The MAC address of the VM can also be obtained from PowerVC using the openstack port list --device-id .
Example: openstack port list --device-id abb72a7a-28cf-4156-8cc8-37a7da2e97b9
Then the following command would provide the location code. In this case, it is “U8284.22A.21B63BV-V4-C2”

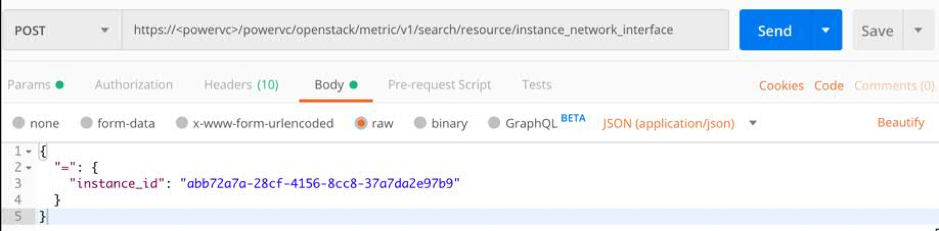
- Run a POST request on the Gnocchi search API to get the list of all network interfaces for the VM. Find out the ID of network interface that lists location code of the CNA listed as “name” param.
For example in the below response, network interface with id “e6e11b74-85d0-5874-b3f1-5ef8ccb2dc87” lists “abb72a7a-28cf-4156-8cc8-37a7da2e97b9” as its instance_id and “U8284.22A.21B63BV-V4-C2” as its name.
Request:
Response:
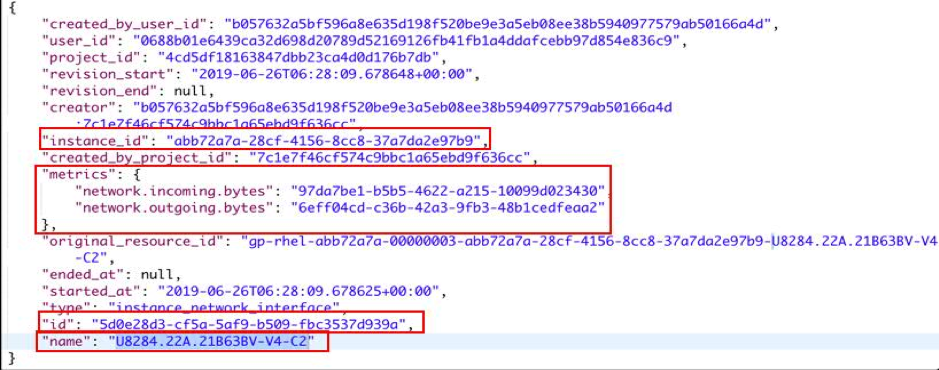
- Use the network interface ID to query metrics of network incoming/outgoing bytes.
GET powervc/openstack/metric/v1/resource/instance_network_interface/5d0e28d3-cf5a-5af9-b509-fbc3537d939a/metric/network.outgoing.bytes/measures
Example 2: Get storage adapter metrics
The following example demonstrates the procedure to obtain storage I/O metrics for a VM. We use NovaLink command line
pvmctl to identify storage adapter name.
- Get the VM ID for which we need storage metrics. The procedure is same as the previous example (refer to step 1).
- Identify the storage adapter.
Get the storage adapter name. On NovaLink, you can get the name of storage adapter by using pvmctl CLI.
For example, the below command provides the storage adapter name on the lpar with ID 4.
pvmctl scsi list --display-fields ServerAdapter.name --where ClientAdapter.lpar_id=4
Output: name=vhost2
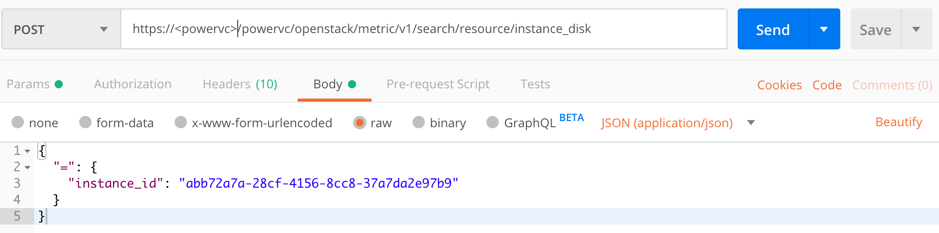
- Run a POST request on the Gnocchi search API to list all disks associated with the VM. Find out the ID of disk that lists the name of the storage adapter in “name” param.
For example, in the below response, VM disk with id “e6e11b74-85d0-5874-b3f1-5ef8ccb2dc87” lists “abb72a7a-28cf-4156-8cc8-37a7da2e97b9” as its instance_id and “vhost2” as its name.
Request:
Response:
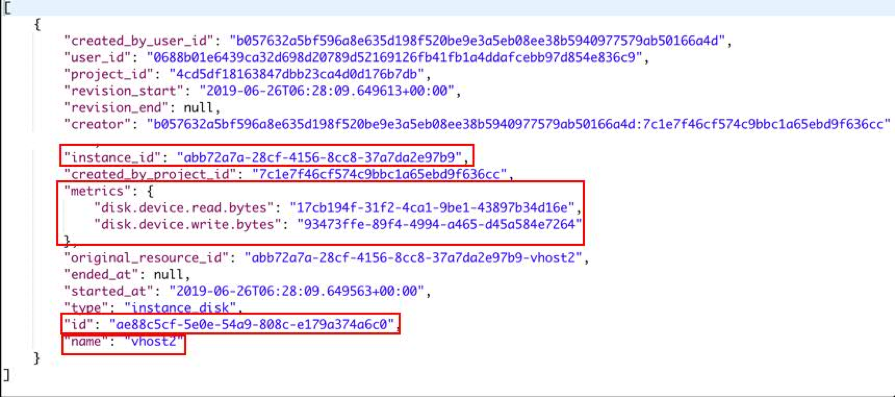
- Use the disk ID to query its storage adapter read/write bytes.
GET powervc/openstack/metric/v1/resource/instance_disk/ae88c5cf-5e0e-54a9-808c-e179a374a6c0/metric/disk.device.read.bytes/measures
Conclusion
And there you have it! You can build upon the I/O metering information for debugging usage from admin perspective, chargeback purposes from cloud usage, etc. based on your requirements.
If you have any questions, post them below. And be sure to follow us on
LinkedIn,
Twitter, and
Facebook so you don’t miss any updates!