By: Arun Mani
Developer - Openstack for POWER
If you experience a problem with any aspect of PowerVC, you might need to review the logs. This article describes where to find the logs, what to expect at each logging level, and how to manage the logs – including how to keep them from getting too big. This information is designed for system programmers and administrators, but can be used by anyone responsible for diagnosing problems related to PowerVC management server. This is a general troubleshooting guide for the most common issues faced with the PowerVC management server and doesn't cover troubleshooting any specific issues related to different components. To troubleshoot problems that are specific to a component, please refer to the troubleshooting section in the PowerVC Knowledge Center, which has more details on the problems and the workarounds available.
Working with logs:
Most services use the convention of writing their log files to subdirectories in this format: /var/log/<service_name>. For instance, nova service related logs can be found under /var/log/nova, and neutron logs gets written to /var/log/neutron. The table below describes the log locations for various PowerVC services:
Node Type
| Service | Log location |
PowerVC Controller
|
nova-*
|
/var/log/nova,
/var/log/nova/nova-compute-*
|
| PowerVC Controller |
glance-*
|
/var/log/glance
|
| PowerVC Controller |
cinder-*
|
/var/log/cinder
|
| PowerVC Controller |
keystone-*
|
/var/log/keystone, /var/log/httpd
|
| PowerVC Controller |
neutron-*
|
/var/log/neutron
|
| PowerVC Controller |
bumblebee
|
/var/log/bumblebee
|
| PowerVC Controller |
selinux errors
|
/var/log/audit/*
|
| All Nodes |
misc (swift, dnsmasq)
|
/var/log/syslog, /var/log/messages
|
| Compute Node - PowerKVM |
libvirt
|
/var/log/libvirt/libvirtd.log
|
| Compute Nodes |
Console (boot up messages) for VM instances
|
/var/lib/nova/instances/instance-<instance id>/console.log
|
| Block Storage Nodes |
cinder-volume
|
/var/log/cinder/cinder-volume.log
|
PowerVC leverages the OpenStack standard of logging levels for all of its services. These are the levels, in increasing severity: DEBUG, INFO, WARNING, ERROR, CRITICAL, and TRACE. Messages only appear in the logs if they are more "severe" than the particular log level, with DEBUG allowing all log statements through. For example, TRACE contains messages only if the software has a stack trace, while the default log level, INFO, contains every message - including those that are only for information. By default, INFO and WARNING messages get logged. If there is a failure, you can also find ERROR with TRACE messages.
Users can set finest logging level by enabling the DEBUG logs. This should further help support teams to identify the problem faster; given the accurate information that gets dumped in the log files for that particular service. This can be done using the openstack-config command. This example shows how to enable debug logs for compute/nova service before collecting the critical log data related to failure:

After enabling debug logs, restart nova services by running this command: /opt/ibm/powervc/bin/powervc- services nova status. Detailed usage of openstack-config command can be found in the Openstack Configure a compute node page.
Effectively managing logs:
The logs for all of the components in PowerVC tend to become huge once you start scaling up the environment. Hence, PowerVC comes packaged with the powervc-log-management command that helps you manage the logs for all PowerVC services. With this script, you can set the log file size limit and number of files to rotate. Once enabled, the log file for the specified services get rotated automatically once the file size limit is reached by creating a zip file for the existing log file. Also, the retain option provides users the flexibility to specify how many log files to retain in their environment. Run powervc-log-management -h to understand how exactly this works.
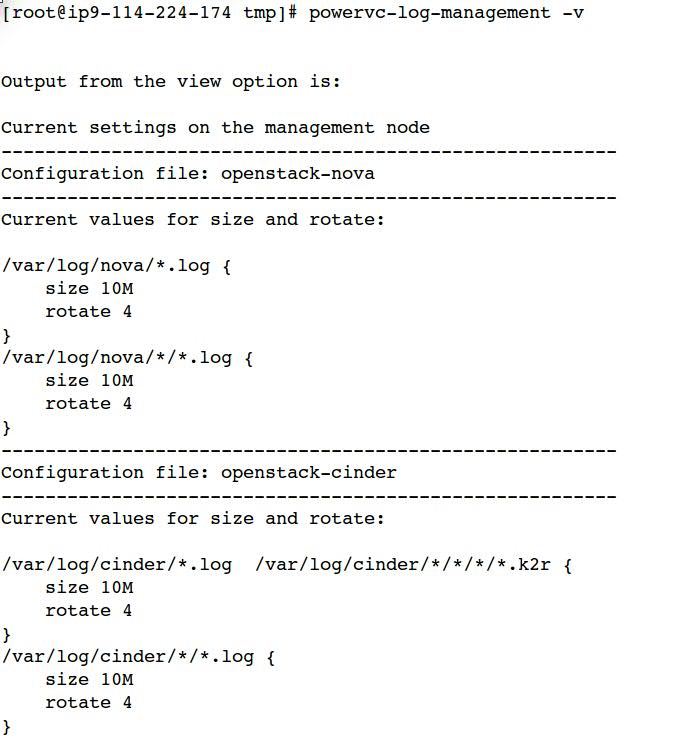
The screen shot below shows how to determine the current log management settings.

With this command, the user gets the flexibility to tune the log settings for any service. Also, this feature helps keep the managed host's disk space utilization under control.
What to look for in the logs?:
Typically, the first thing to look in the logs when you hit a problem is for the error message or the stack trace that has the details on which part of the python module the problem is generated, for that particular component. This should explain the problem in detail, as well as its origin. You should also look for the exception that gets logged for any failure, which will also help identify the root cause of the failure. If there are no exception/stack trace messages getting dumped to the logs, it means that the problem might not be of severe impact and the user can continue with their operation. However, in such cases, at least a warning message will get logged to make sure that we don't miss out on anything that's happening in the PowerVC environment.
The root cause of most of the issues seen in PowerVC can be triaged with the default logging levels. If the support team requires more detailed logging, you can enable the debug logs and perform the action again to capture all the details. Remember, if the debug logs are enabled, you should use powervc-log-management function to manage storage usage.
To have a stable environment, you want to detect failure promptly and determine causes efficiently. With a distributed system, it's even more important to track the right items to meet a service-level target. By knowing where the logs are and how to manage them, you can analyze most issues you encounter, allowing you to keep your environment running smoothly. If you have comments or questions, please respond to this post. Don't forget to follow us on LinkedIn, Twitter, and Facebook!