If you experience a problem with any aspect of PowerVC, you might need to capture diagnostic data for debugging. This is a general troubleshooting guide for common issues faced with the PowerVC management server and doesn’t cover troubleshooting any specific issues related to the other components. To troubleshoot problems that are component-specific, please refer to the
PowerVC Knowledge Center , which has more detailed topics on the problems and workarounds available.
Capturing diagnostic data using the powervc-diag commandPowerVC is built on top of the open source cloud platform named OpenStack. By virtue of this, PowerVC comprises of a bunch of services; and capturing diagnostic data for debugging a failure could mean analysing data across multiple services. Manual collection of logs and configuration information for all components is expensive and time consuming as there are so many different log files. To overcome this challenge, PowerVC has a utility, that enables diagnostic data collection for the entire PowerVC environment (both the management server and the managed hosts).
If there is a failure, you have to invoke diagnostic data collection by running the
powervc-diag command. This captures the current state of the management server and managed hosts by collecting all of the service logs, service configuration files, database information and everything that’s required for the support team to analyse the problem and provide a quick solution. Because
powervc-diag provides an option to collect logs from hosts such as HMC (Hardware Management Console) or PowerVM/Novalink or KVM, this tool provides truly end-to-end information to the support team.
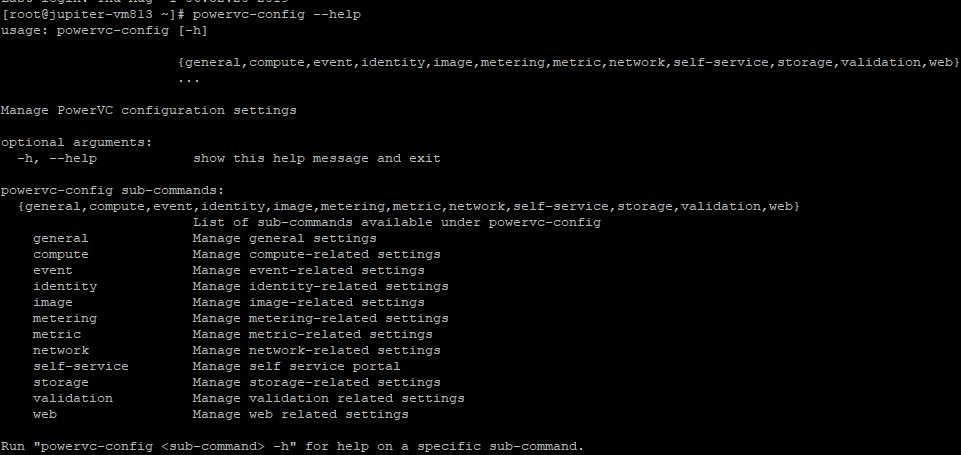
Capturing logs with debug enabledBy default, the log files in PowerVC are set at the INFO level. If you want the logs to have lower level of detail, it is recommended that you enable debug log level, run the operation and then capture the diagnostic data with
powervc-diag. You might want to disable debug soon after that. The
powervc-config command can be used as seen below to help with the same. Please note that running this command with the –restart option restarts the service and causes disruption to any ongoing operations. Debug is enabled only with the –restart option.
 Inside the diag archive
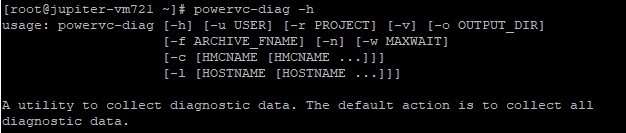
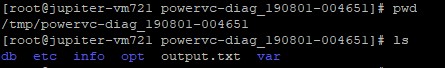
After capturing the data, the
powervc-diag command creates a zip file (the name of the file is suffixed with the time stamp). By default, this is stored in the /tmp directory. This command has various options that specify what information to capture. You can run this command with -h for more details. The available options are:
If no options are provided as input, it will collect all diagnostic data related to all PowerVC services/components. All Novalink diagnostic logs will be collected by default. Listed below are the different categories of diagnostic data that gets captured as part of
powervc-diag command:
 Configuration Files
The configuration files for all PowerVC services can be found under
/tmp/powervc-diag_timestamp/etc/. These include *.conf and *.ini files that provide information on the configuration used while loading the different PowerVC services.
 Log Files
This is a critical section of the zip file where all the logs related to services get captured and stored. You can find this under
/tmp/powervc-diag_timestamp/var/log/. Any failure will be logged as ERROR with a complete stack trace. Additionally, PowerVC also captures the system logs from
/var/log/messages which might have some critical information about issues related to service startup and other kernel related information that should help in debugging.
 System information
The /info folder that is created as part of the zip contains some general information on individual components to help with problem analysis. For instance, the general info data for the nova service will contain details like hypervisor HA policy, hypervisor run-time policy, hypervisor statistics data, etc., to help troubleshoot any problems with the managed resources. Additionally, this section also contains the services information, user information, processes information, etc., from the management server.
 DB snapshot
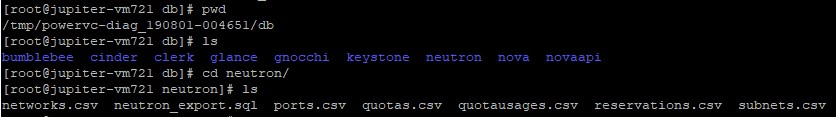
As mentioned previously, the
powervc-diag command takes a snapshot of the current state of the database in the PowerVC management server for all its services and managed resources. The exported database tables can be found under the /db folder in the zip file.
 Running with User and Project
The only OS user that can run(execute)
powervc-diag (as per file permissions of the command) is the ‘root’ user (or a sudo user). If ‘root’ user doesn’t have any role assignment in PowerVC, then certain diagnostic data collection related to compute & image service collected via REST APIs will fail. We can still collect those diagnostic data by using another user having a role in PowerVC using -u/--user argument.
Below are few examples on running
powervc-diag with available arguments.
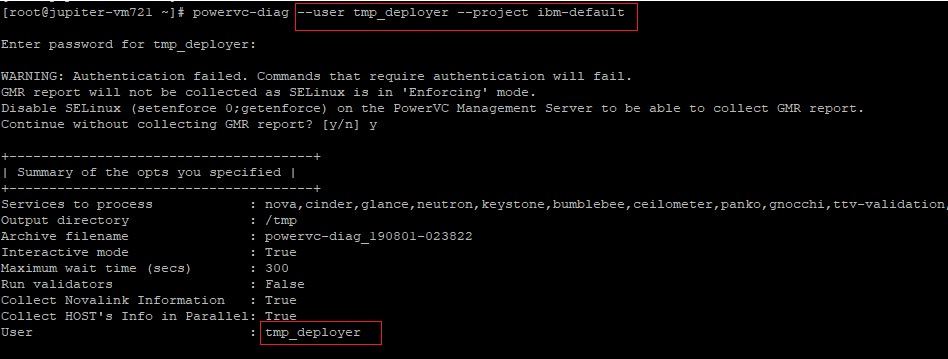
In the above example, the user and the project (that the user has admin role against) has been explicitly provided as inputs, so that the command is able to collect diagnostic data from compute & image REST APIs. If -u/--user option is not specified, then default user will be ‘root’ (root used by default, has admin role on ibm-default project and thus can run this command, unless this role assignment has been explicitly removed from the PowerVC). If -r/--project is not explicitly specified, then the default value used is ‘ibm-default’.
Running with hmcinfo and maxwaitThe below command demonstrates how
powervc-diag can be run to capture diagnostic data associated with two HMCs (ipaddress given as input separated by comma).
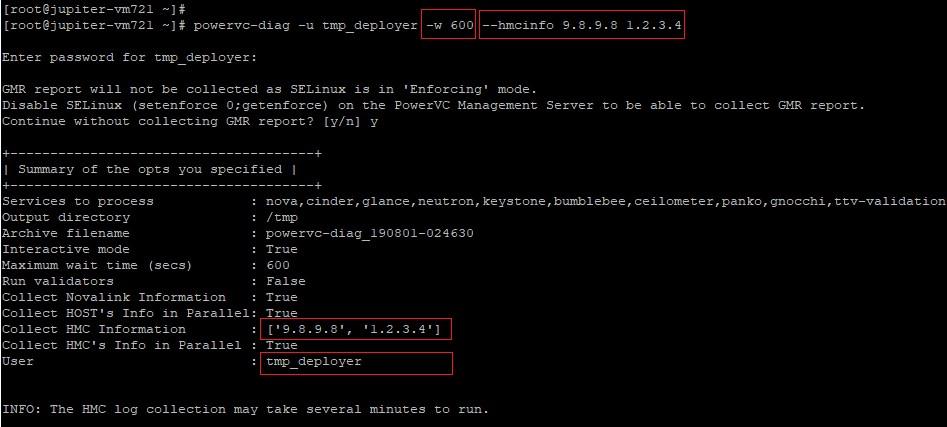
The -w/--maxwait option has been used in the above and set to 600 seconds (10 minutes). -w/--maxwait option sets an upper limit on the execution time of a single command & its default value is 300 seconds (5 minutes). The
powervc-diag command internally runs multiple commands to collect diagnostic data. Some commands require more time to execute (like pedbg logs in case of HMC & Novalink). This is when an increased max wait time has to be specified.It is thus highly recommended that -w argument is given as an input when –hmcinfo is given as an input.
ConclusionThe
powervc-diag command is typically run and the archive is provided to the serviceability team as part of a support request. Hope the above steps help you run this diagnostic utility with ease. If you have any questions about this topic, please comment below. Watch this space for more information about troubleshooting your environment. In the meantime, don't forget to follow us on
LinkedIn,
Facebook, and
Twitter.
Authors Arun Mani (arun.mani@in.ibm.com), Abhishek M Sharma (abmsharm@in.ibm.com),
Divya K Konoor(dikonoor@in.ibm.com).
#troubleshooting